


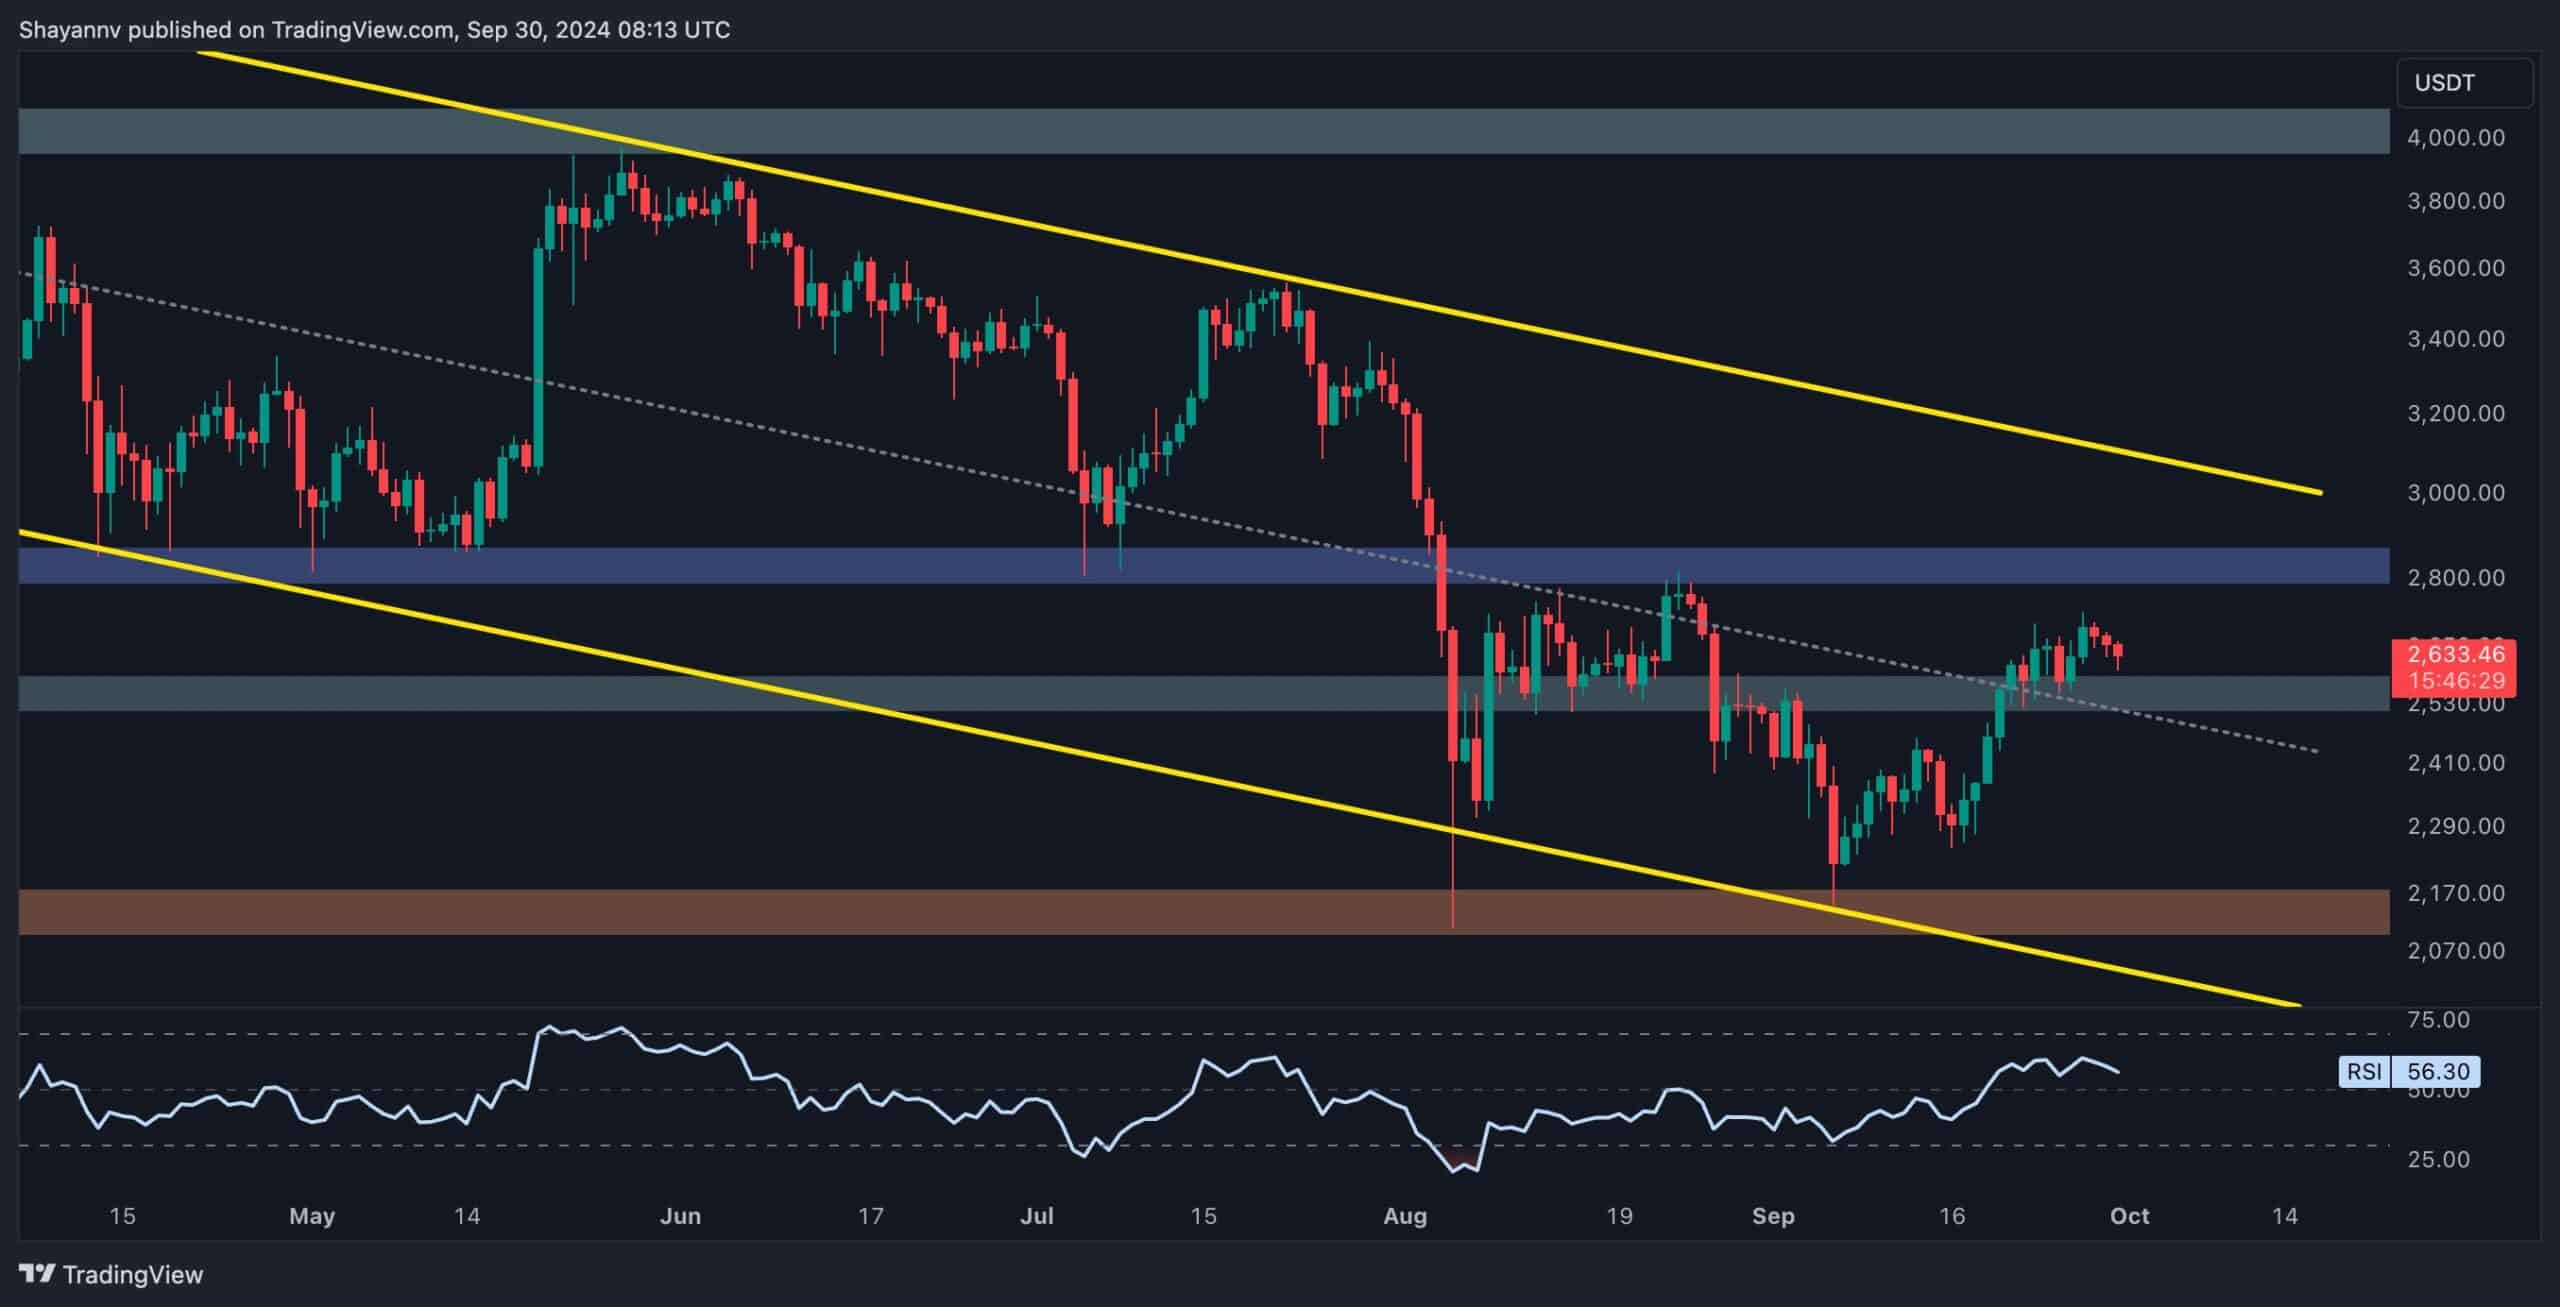
After breaking above the middle boundary of the descending price channel, Ethereum has temporarily lost its bullish momentum, slightly approaching the crucial $2.8K resistance.
The upcoming price action around this level will play a decisive role in shaping Ethereum’s trajectory in the mid-term, with potential outcomes dependent on whether buyers can overcome the selling pressure.
Technical Analysis
By Shayan
The Daily Chart
Ethereum’s daily chart reveals that following a pullback towards the middle threshold of the descending price channel, the market faced lower trading activity, leading to a slight consolidation stage with minimal volatility.
During this consolidation, the ETH price has slightly retraced toward the significant resistance at $2.8K, a critical level that aligns with Ethereum’s previous major swing high.
This price range is expected to act as a strong barrier, with considerable supply resting here, making it a key battleground for buyers and sellers. A breakout above could signal the continuation of the uptrend and a shift towards bullish sentiment in the market, while rejection would suggest the potential for a reversal or consolidation toward the $2.5K support.
The 4-Hour Chart
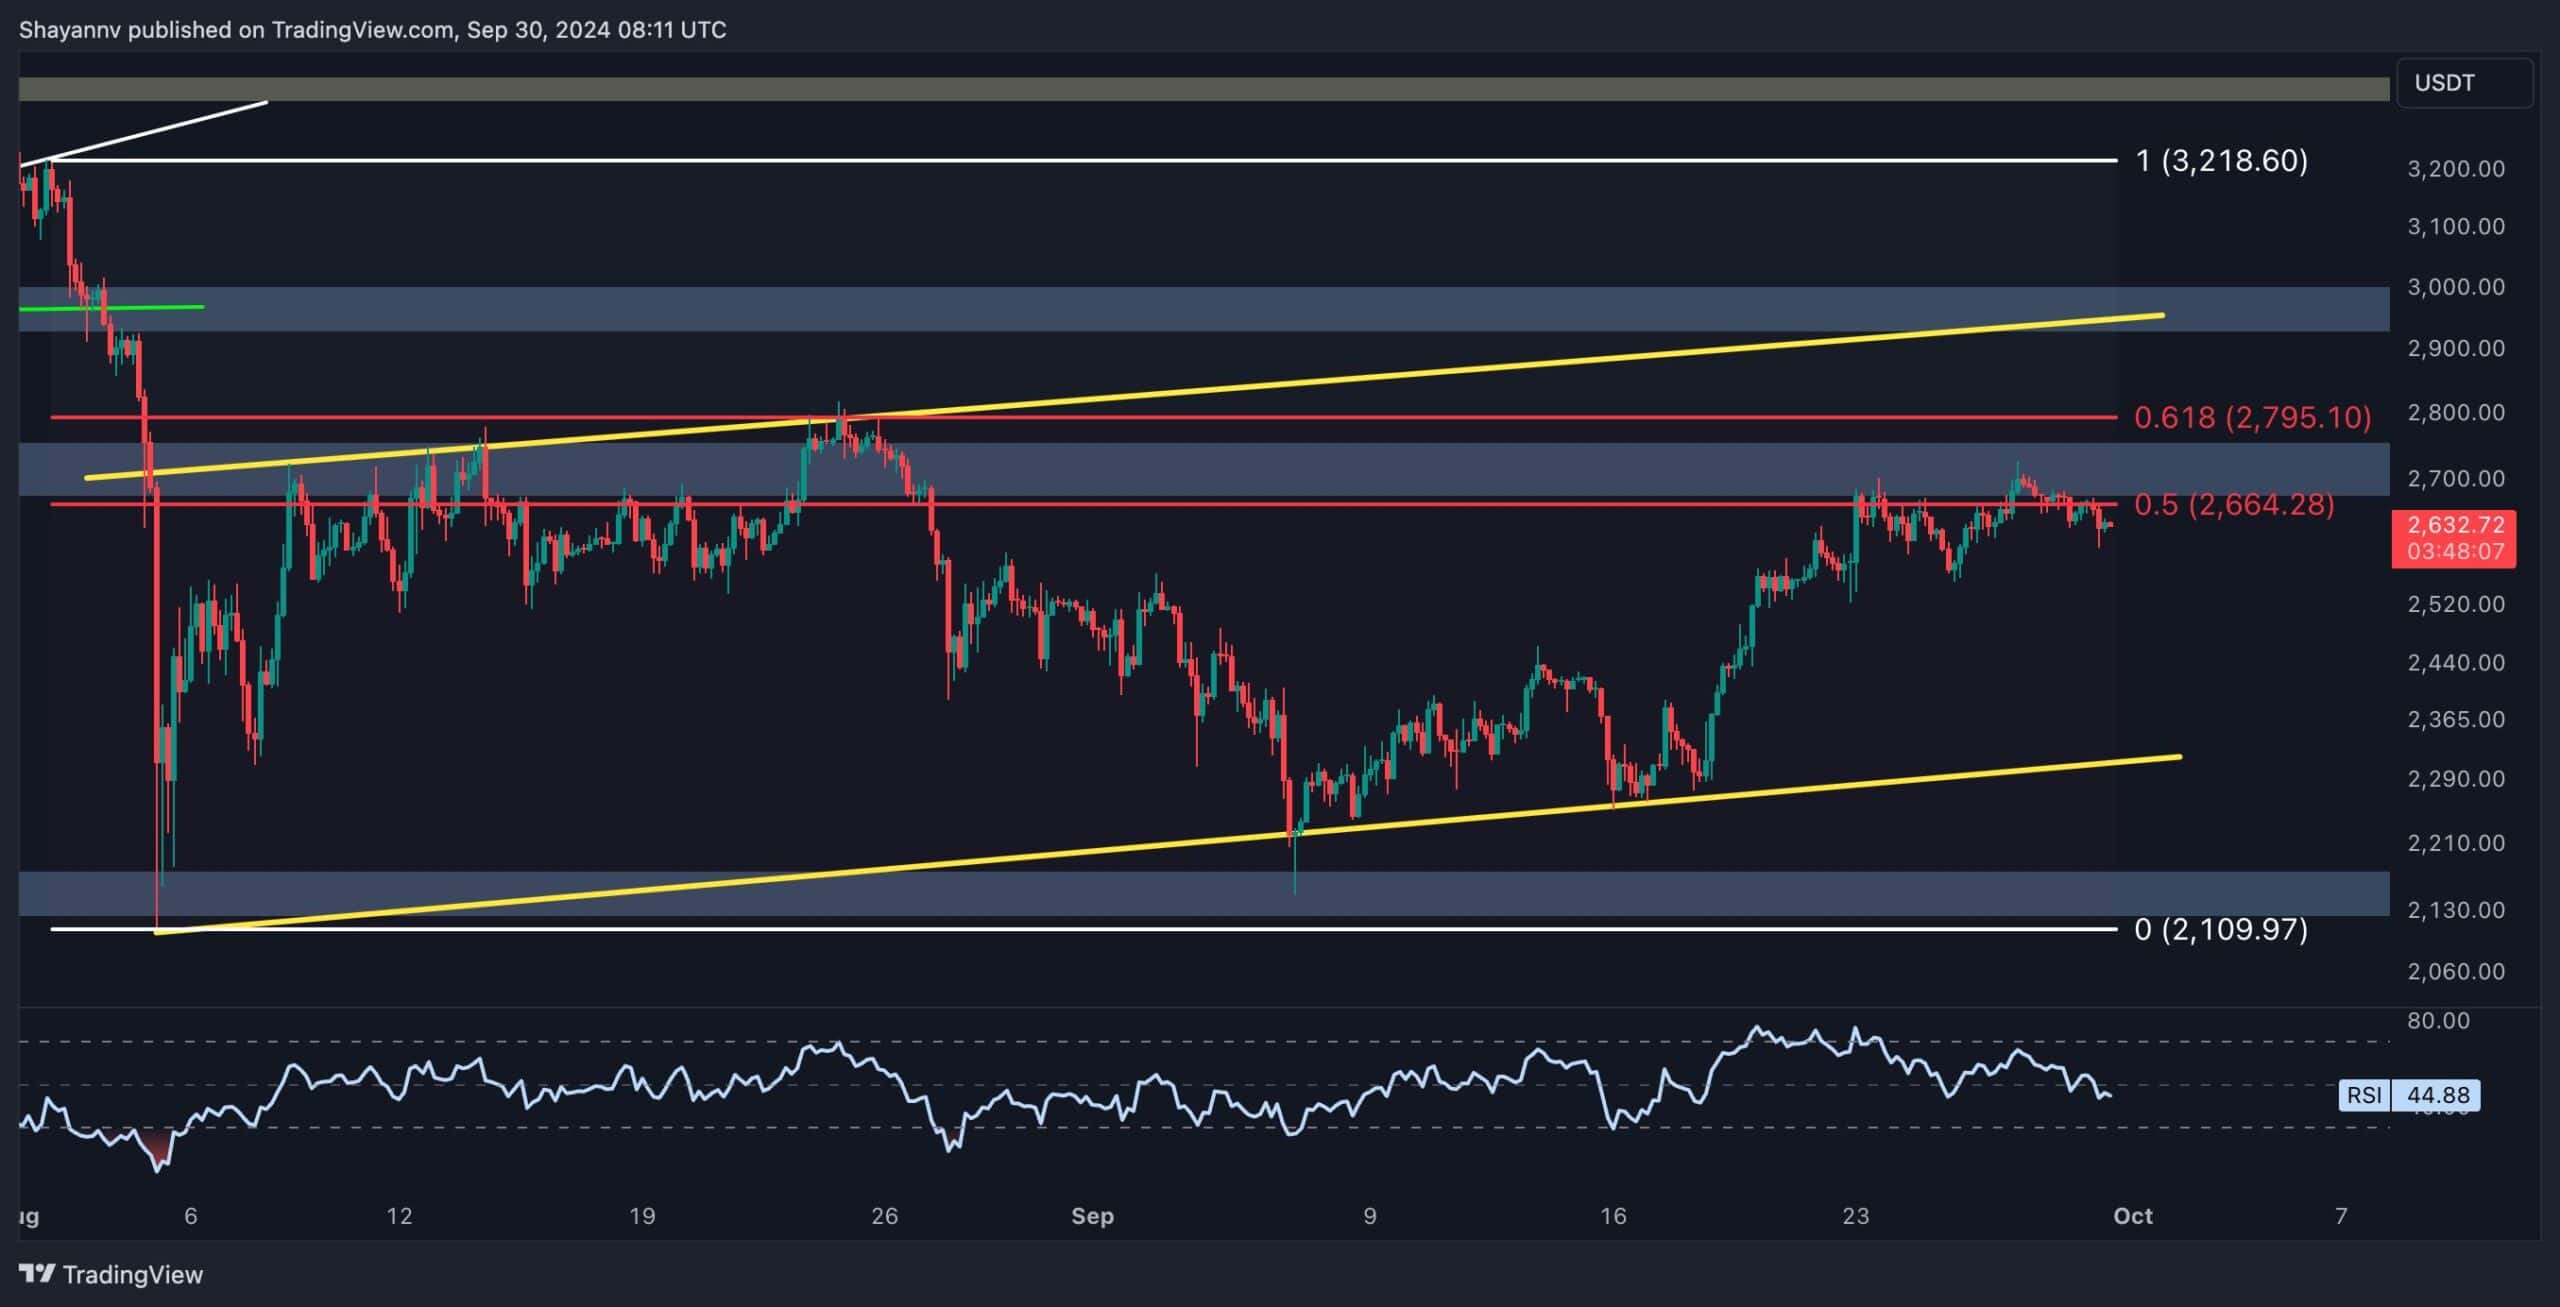
On the 4-hour chart, Ethereum’s bullish momentum has waned from 0.5 ($2.6K) to 0.618 ($2.8K) Fibonacci retracement zone, forming a three-drive pattern, a bearish technical indicator.
This suggests that sellers are gaining strength in this price range, which has historically been a robust resistance area. If sellers assert control, a bearish retracement toward the lower boundary of the ascending flag pattern, around $2.4K, could follow.
Conversely, if buyers manage to regain control and push the price above the $2.8K resistance, Ethereum is likely to extend its uptrend toward the next significant target at $3K, marking a potential breakout and continuation of the bullish momentum.
Onchain Analysis
By Shayan
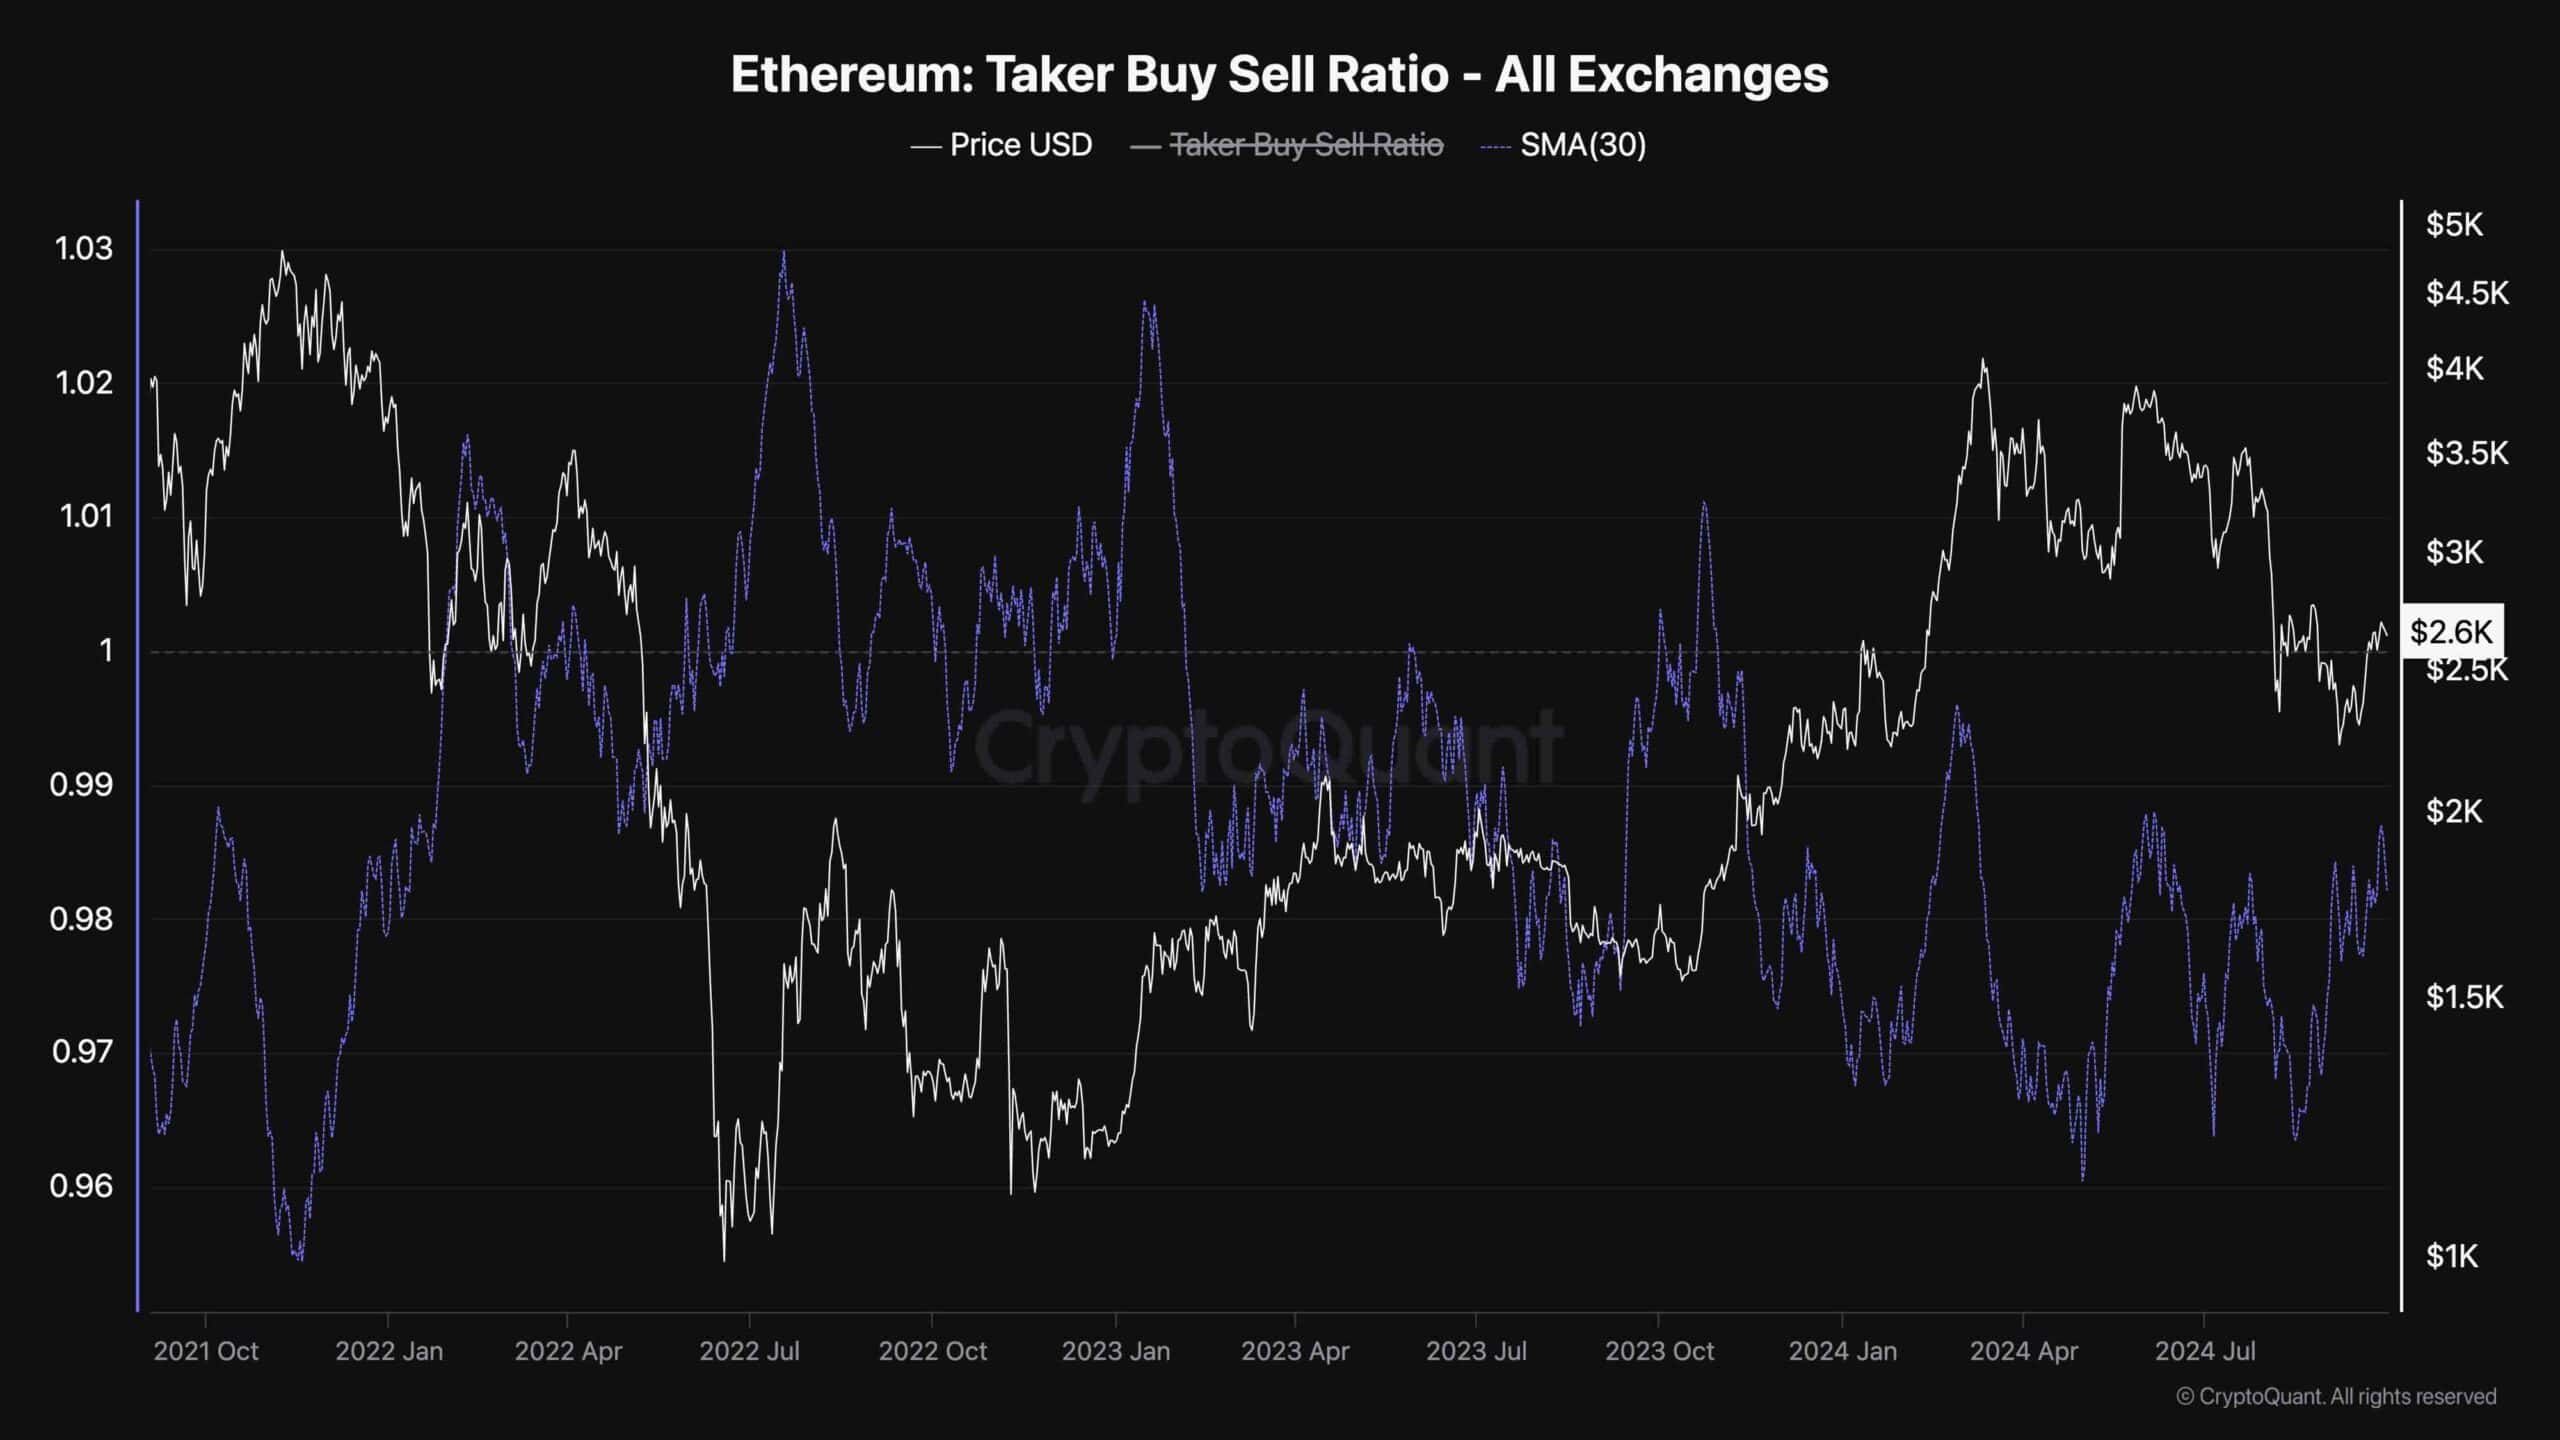
Analyzing key metrics from the perpetual markets can provide valuable insights into potential future price movements. One such metric is the Taker Buy/Sell Ratio, which measures the proportion of market buy orders to market sell orders across the futures market.
As market orders directly influence price action, this ratio can help anticipate sentiment and market direction shifts.
Over the past few months, the 30-day moving average of the Taker Buy/Sell Ratio for Ethereum has consistently remained below 1.
This suggests that sellers have been more aggressive than buyers, increasing market supply. However, the ratio has recently rebounded alongside a price surge from the $2.1K support zone, signaling a potential shift in market sentiment. As the ratio approaches the critical threshold of 1, the selling pressure in the futures market may be waning. Should this upward trend persist in the Taker Buy/Sell Ratio, it could signify a squeeze in aggressive selling, setting the stage for a market rally.
The post Why is ETH Stalling Behind the Crypto Market? (Ethereum Price Analysis) appeared first on CryptoPotato.