


Ripple has encountered significant selling pressure near the $0.64 resistance level, leading to a sharp decline toward a critical support area around the 200-day moving average at $0.54.
The key question now is whether this drop is merely a temporary correction or the beginning of a more sustained bearish phase.
XRP Analysis
By Shayan
The Daily Chart
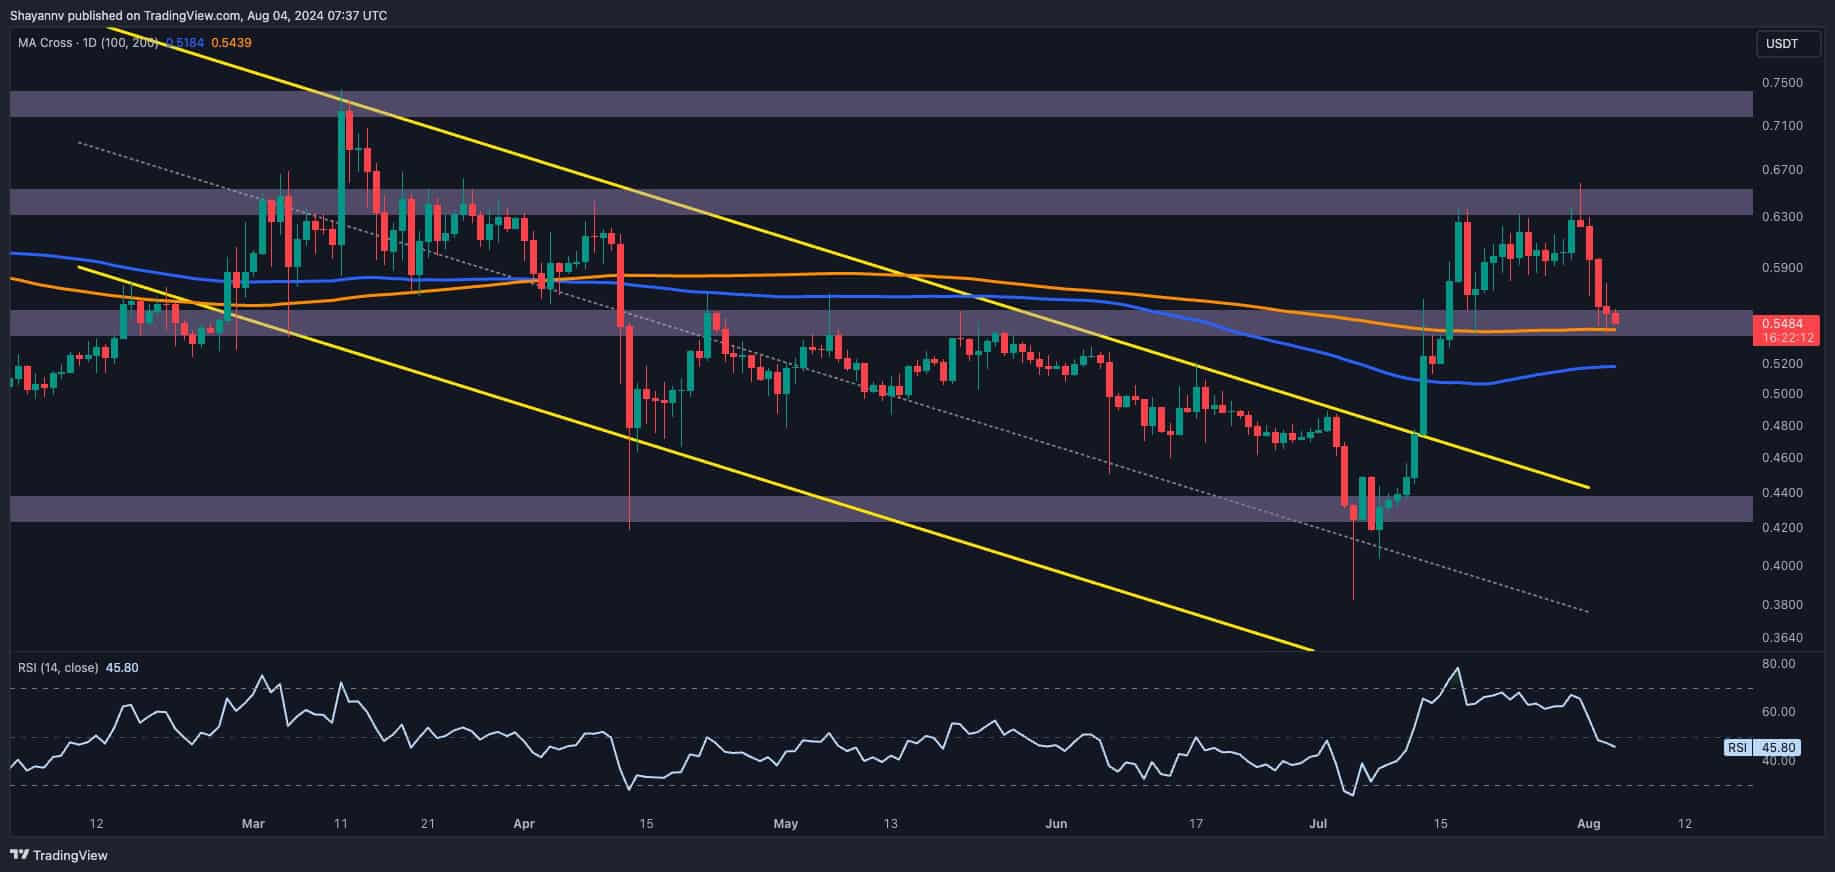
An in-depth examination of Ripple’s daily chart reveals that the recent bullish surge encountered significant resistance at the crucial $0.64 threshold, which led to a period of sideways consolidation. During this phase, a notable bearish divergence appeared between the price and the RSI indicator. It was followed by a substantial 17% decline, bringing the price down to a critical support zone.
The latter includes the key 200-day moving average at $0.54, which is acting as a strong support level. This area is potentially filled with sufficient demand and buying interest. If XRP can maintain its position above the $0.54 support and rebound, it would suggest that the recent decline is likely a correction, and the broader bullish trend could resume. In this scenario, buyers would aim to retest the $0.64 resistance level and possibly target higher levels.
On the other hand, if the price breaks below the 200-day MA with strong selling momentum, it would signal a potential shift toward a bearish trend. This could put Ripple at risk of further declines, with the next major support likely around the 100-day MA at $0.51 or even lower. At the time of this writing, the price is attempting to trend lower.
The 4-Hour Chart
On the 4-hour chart, after facing increased selling pressure near the critical $0.64 level, Ripple’s price initiated a significant bearish move, breaking below the ascending wedge’s lower boundary.
This action indicates a strong presence of sellers in the market and suggests the potential for sustained bearish retracements.
Currently, the price has reached a crucial support region around the $0.54 mark, where the buying pressure might emerge in the coming days.
However, if sellers manage to push the price below this critical threshold, a long-squeeze event could occur, further accelerating the bearish trend. In this bearish scenario, the next target for sellers would be the price range between the 0.5 ($0.51) and 0.618 ($0.48) Fibonacci levels.

The post Ripple Price Analysis: Here’s Why XRP is Plunging Toward $0.5 and What to Expect Next appeared first on CryptoPotato.