


Ethereum’s recent price movements reveal a strong seller presence, particularly around the critical resistance region at the 100-day moving average.
This price action suggests increased downward pressure, with a corrective consolidation expected in the near term.
Technical Analysis
By Shayan
The Daily Chart
Ethereum recently encountered heightened selling activity at the $2.6K resistance area, aligned with the 100-day moving average. This led to a rejection, pushing the asset back toward the dynamic support at the channel’s middle trendline near $2.3K. The presence of sellers at this resistance zone suggests it remains a significant barrier for buyers, at least for the middle term.
Currently, ETH is trading within a confined range between the channel’s middle support boundary and the 100-day moving average. A new uptrend could be underway if the price successfully breaks above the 100-day MA and confirms a pullback.
In this scenario, Ethereum’s targets would be the 200-day MA at $2.9K and the channel’s upper boundary near $2.8K. However, if selling pressure intensifies and ETH breaks below $2.3K, it may revisit the $2.1K support, likely leading to further retracements.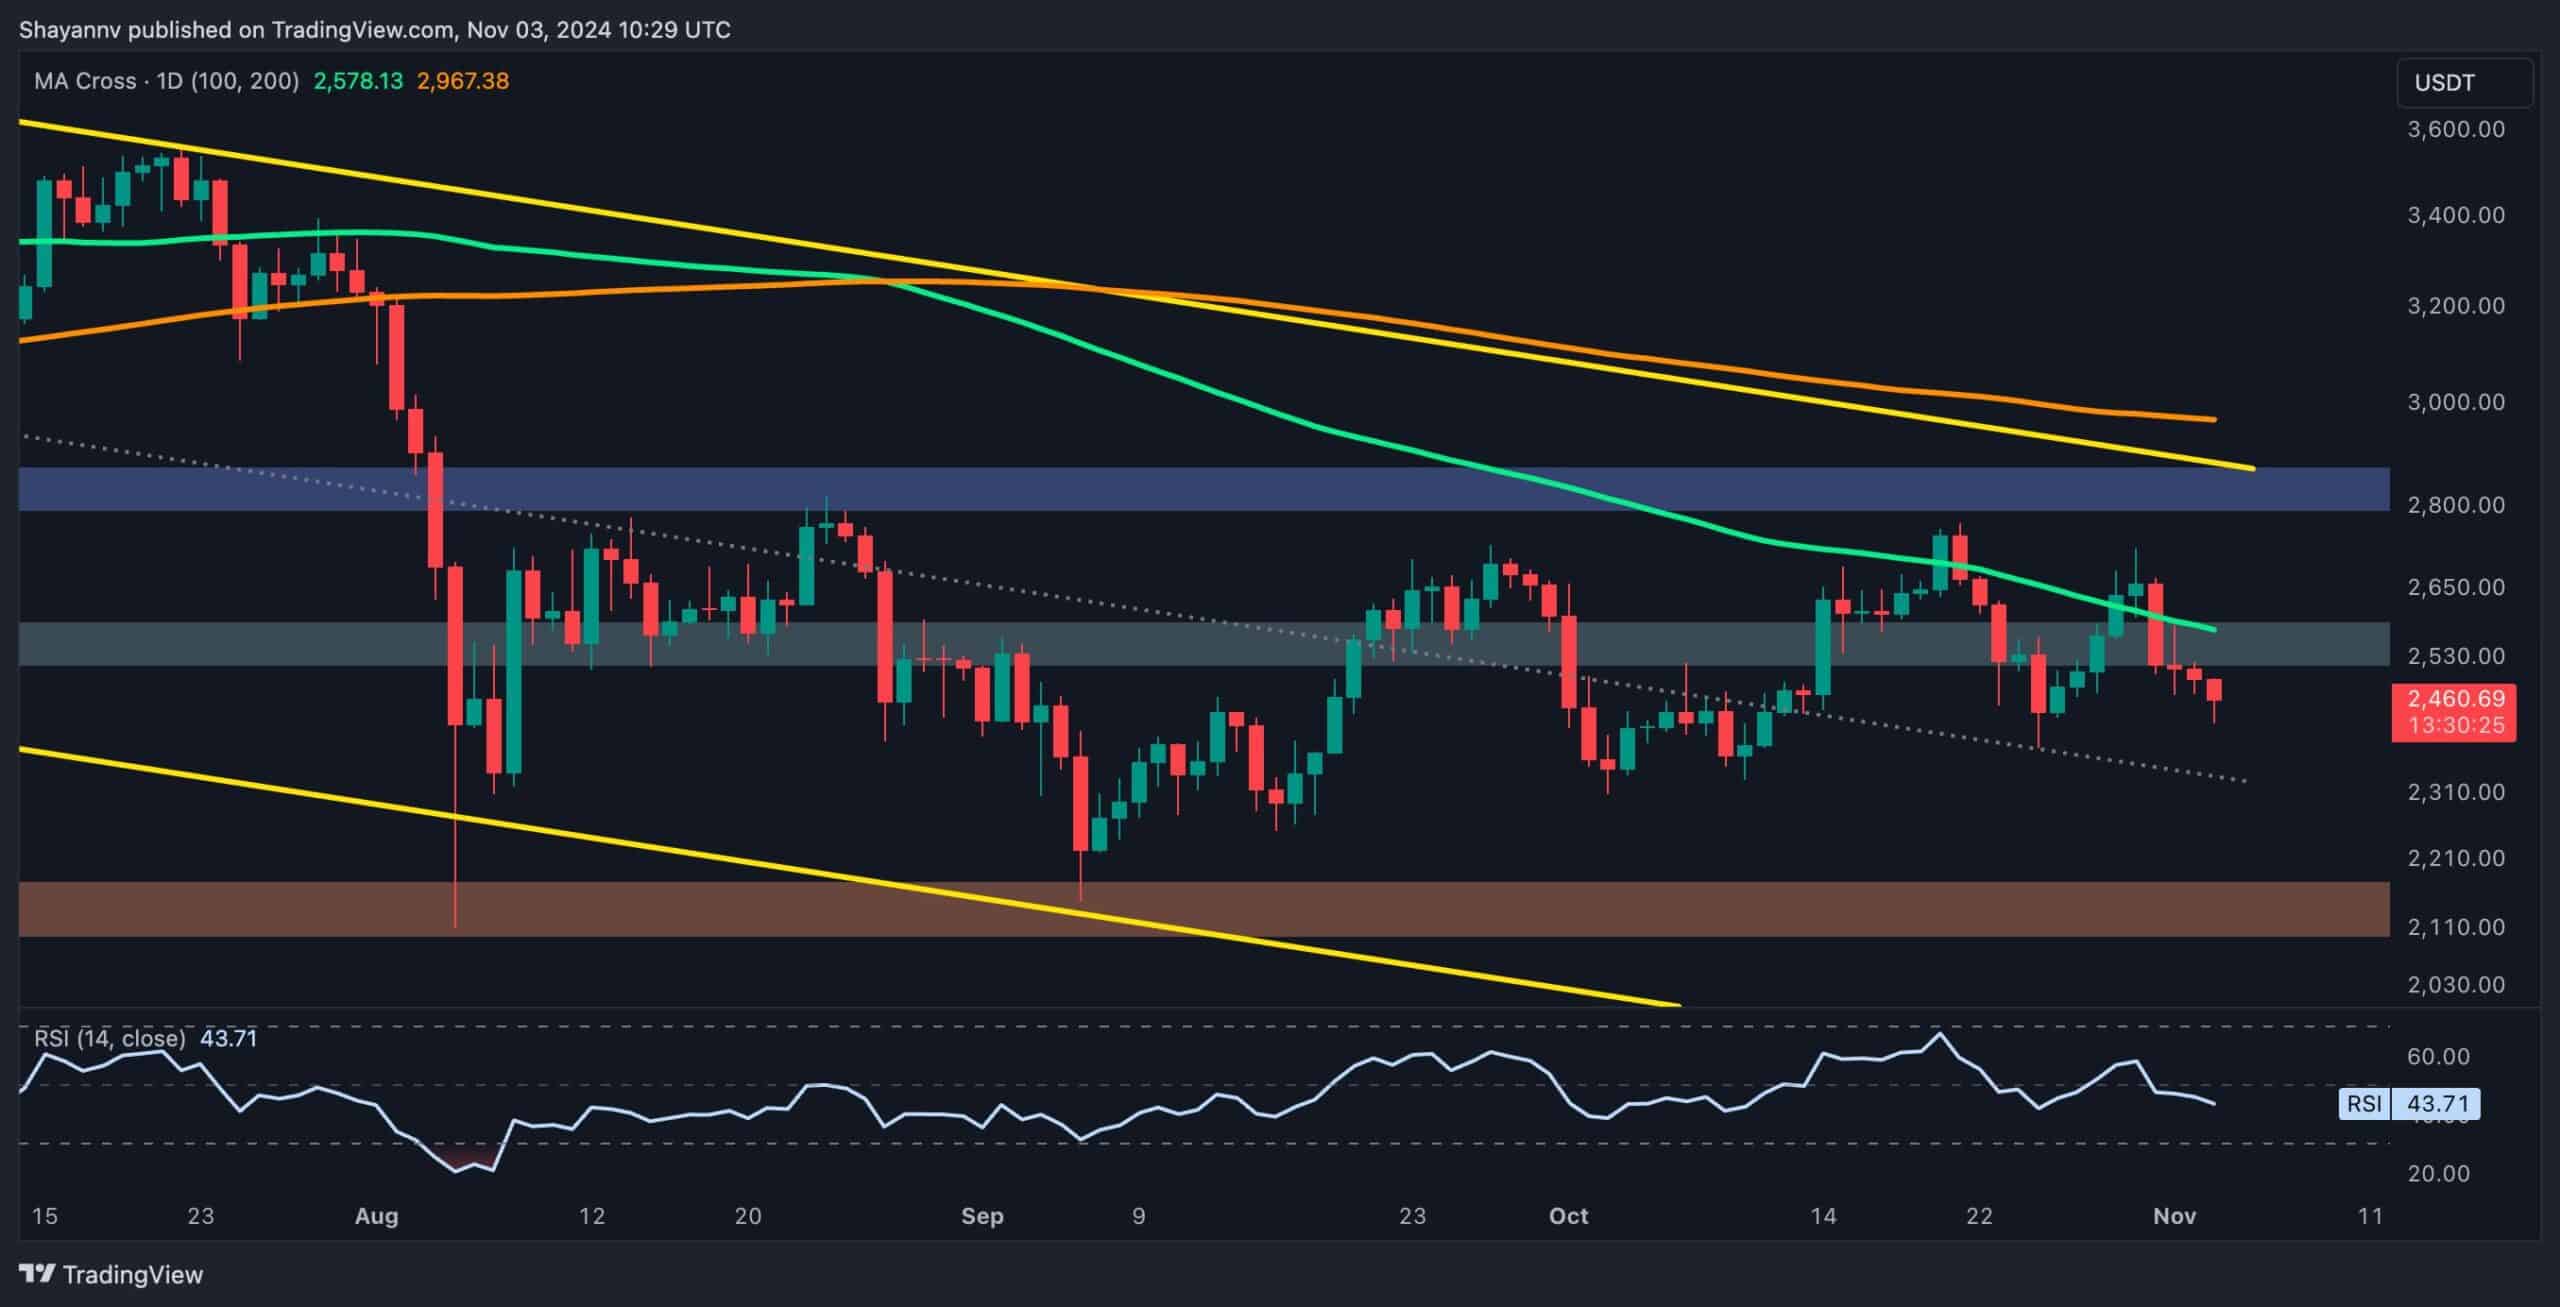
The 4-Hour Chart
On the 4-hour chart, Ethereum’s recent surge met significant selling pressure around the resistance zone between the 0.5 and 0.618 Fibonacci levels ($2.6K-$2.8K). This area has served as a strong barrier, indicating a supply concentration. A shift toward a bullish trend will depend on price action around this zone and a confirmed breakout.
Currently, Ethereum is holding near the lower boundary of the flag at $2.4K. A break below this support could trigger a liquidation cascade, potentially driving the price toward $2.1K. However, the more likely scenario involves a consolidation phase around this support level, with ETH potentially rebounding toward the 0.5 Fibonacci level until a decisive breakout occurs.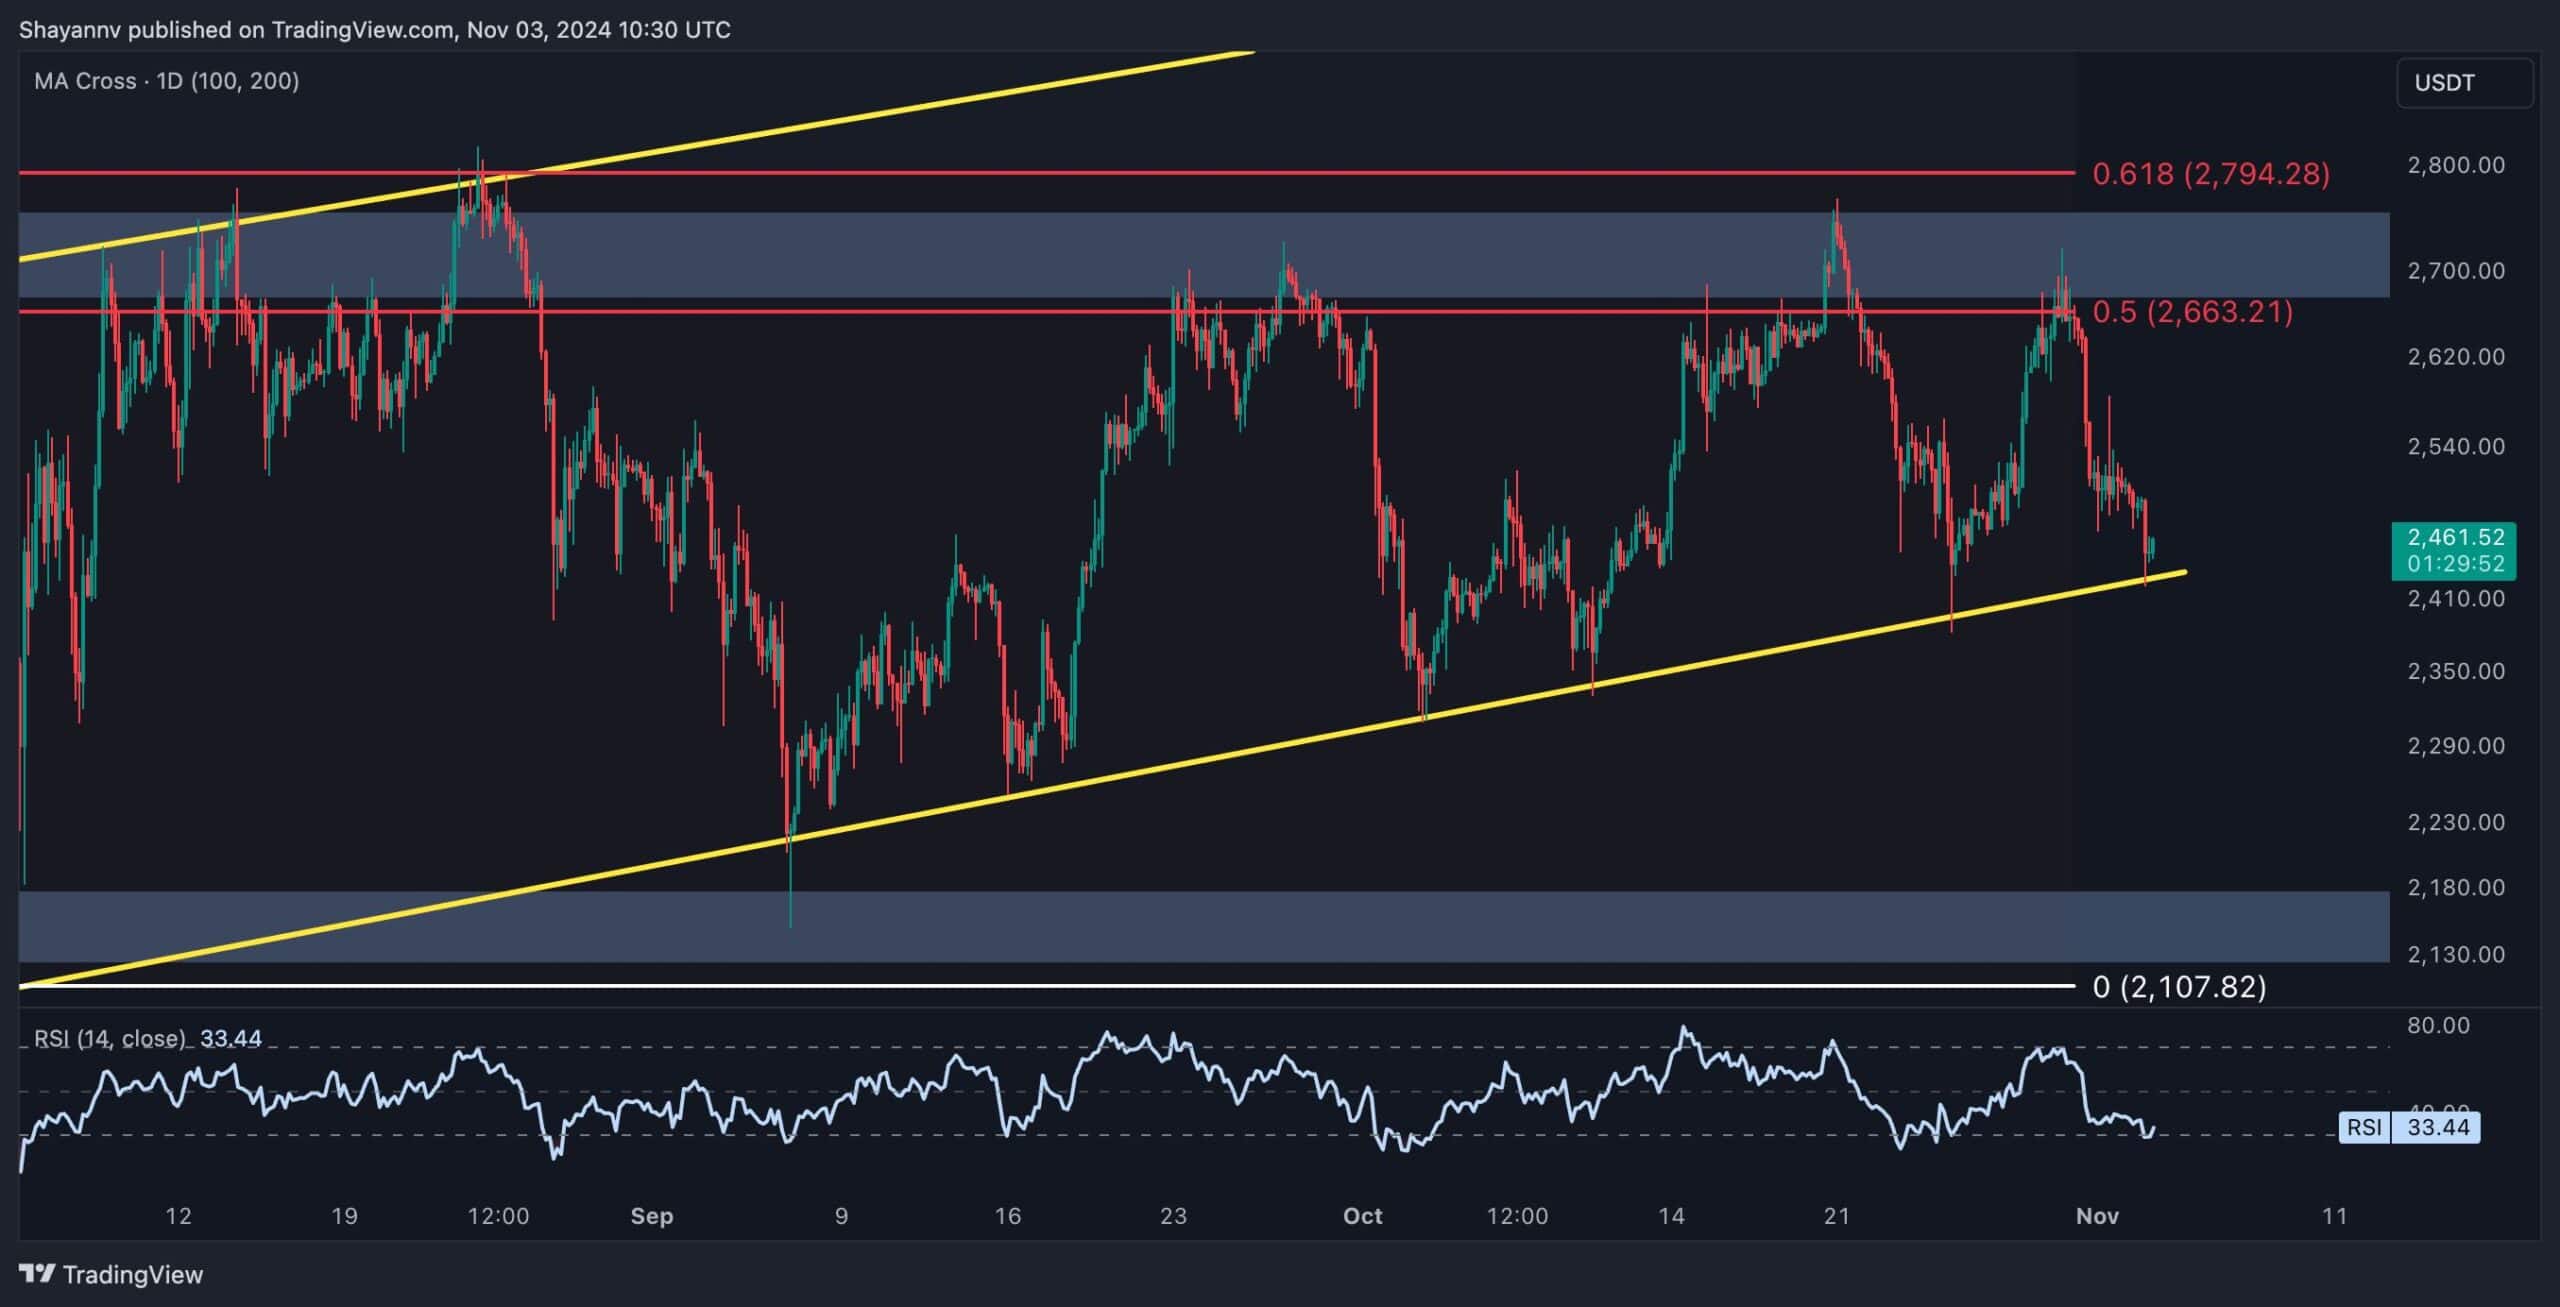
Onchain Analysis
By Shayan
Ethereum’s price has been consolidating within a narrow range, signaling market indecision. However, futures market insights reveal that a breakout could lead to a substantial liquidation event, likely amplifying the prevailing trend.
Based on the chart, liquidity has concentrated below the $2.4K level, suggesting this price range may be pivotal in the short term. Significant liquidity pools below $2.4K indicate that a downward breakout could attract more sellers and trigger long buyers to close their positions, intensifying the bearish momentum.
This scenario raises the possibility of a long squeeze, where a cascade of liquidations could drive Ethereum’s price down to the $2.1K support level. For sellers, the area below $2.4K is an attractive threshold for lowering prices. Conversely, it represents a crucial defense line for buyers, whose actions near this level will be critical for determining the broader market trend.
If ETH breaks below $2.4K, it could quickly drop toward $2.1K due to the cascading effect of long liquidations. Alternatively, intense buying pressure at or near $2.4K could help stabilize the price, potentially averting further declines.
Ultimately, Ethereum’s price action near the $2.4K threshold will be decisive for the short-term trend, and any movement beyond this range could signal a more decisive directional shift.
The post Ethereum Price Analysis: Is ETH Doomed to Dump to $2.1K After Recent Rejection? appeared first on CryptoPotato.