


Several altcoins have surrendered their recent gains this week amid rising geopolitical tensions, with Polkadot (DOT) facing similar challenges. The latest market correction pulled the altcoin’s price down to $4.04, a drop of over 14% in just three days.
At times like this, it’s important to take a step back and examine some fundamentals and traders’ sentiment in the face of popular industry analysts’ conclusions.
Polkadot On-Chain
One of the most important on-chain metrics that track the network’s activity over time is the number of daily active users and new users joining the ecosystem.
While the number of new accounts on Polkadot has remained relatively the same since May last year, the number of active users has increased by more than 25%.
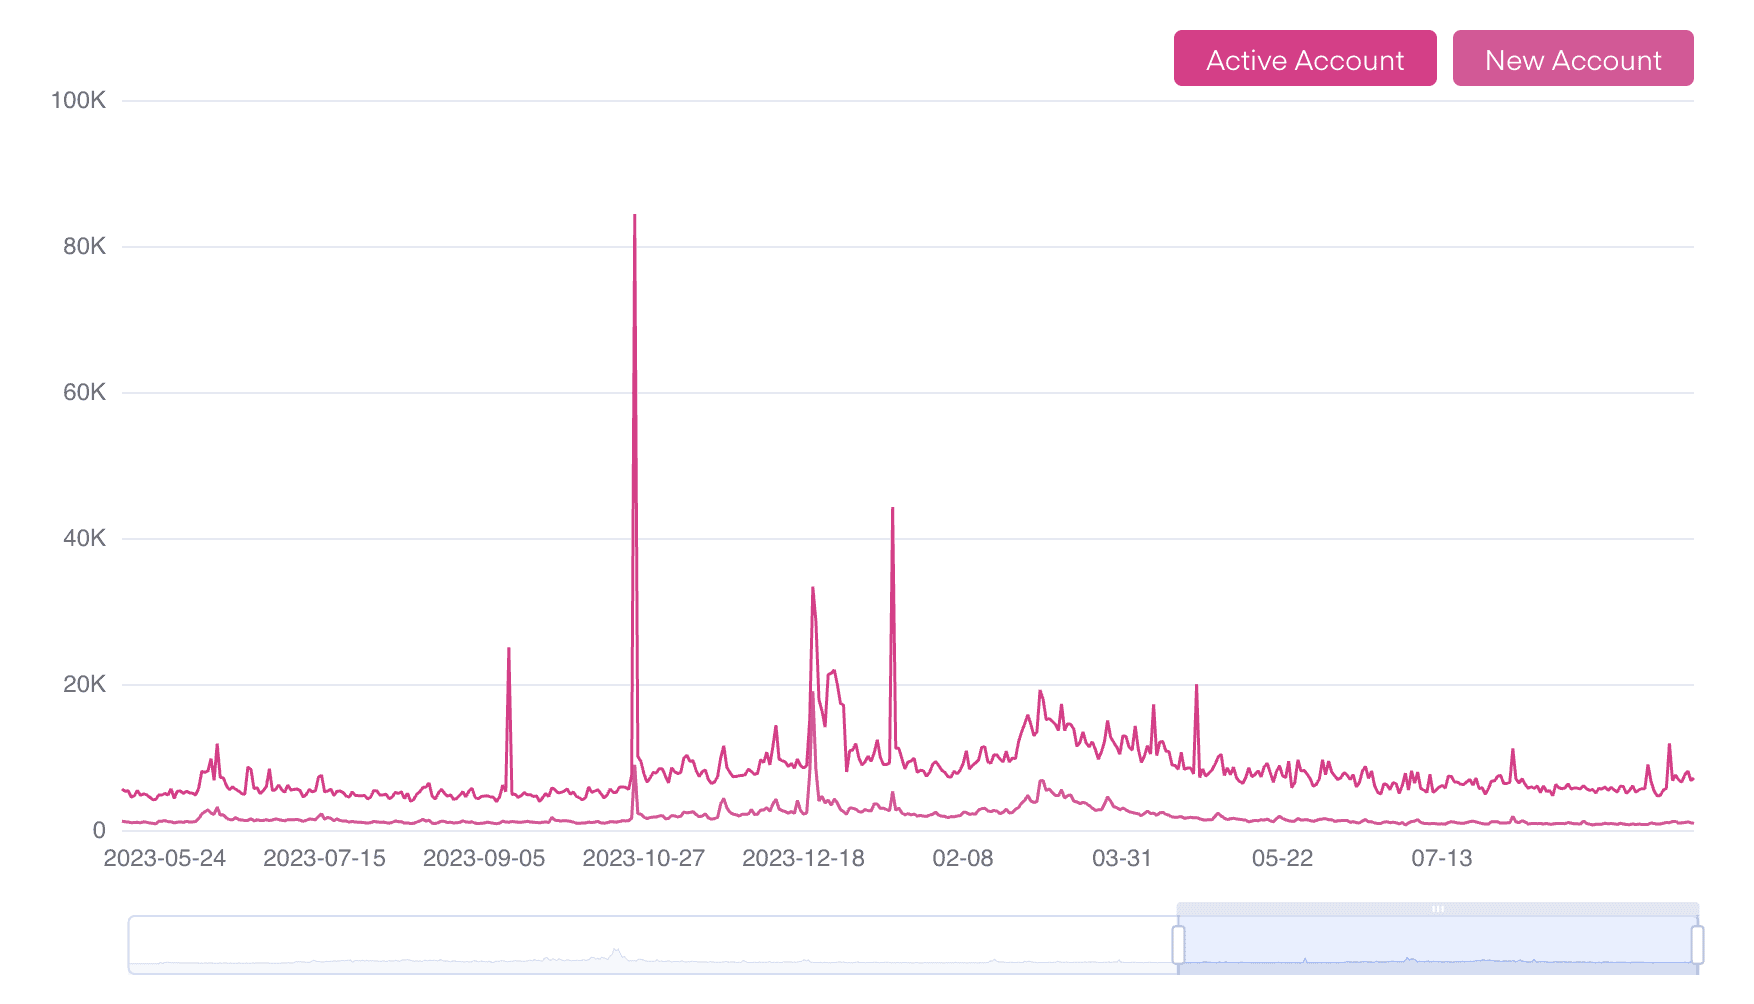
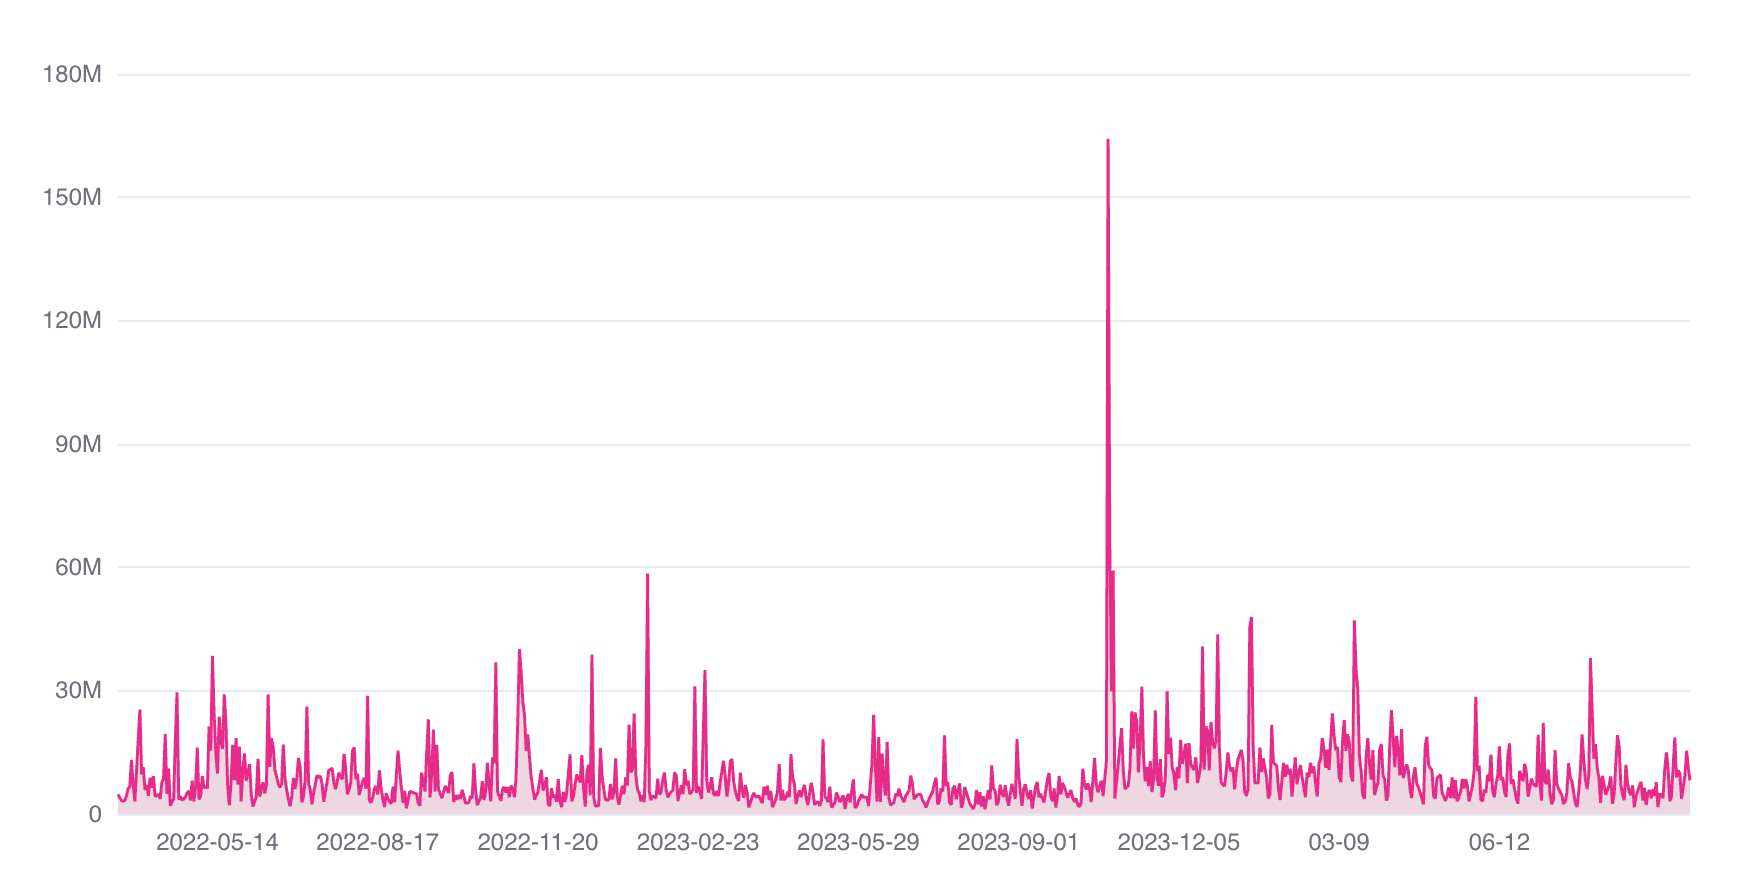
The amount of DOT transferred daily has also increased significantly during this period, showing that the network is processing larger transfer volumes.
DOT’s Imminent Breakout – Are Investors Ready?
One analysis indicates that DOT is poised for a significant breakout. The altcoin appears to be approaching the conclusion of its accumulation phase and could potentially be on the verge of breaking out of a long-standing falling wedge pattern.
According to its findings, recent movements in major large-caps suggest that DOT is poised to follow this trend, making it only a matter of time before it experiences a substantial upward shift. The projected targets for this breakout, indicating key resistance levels, are set at $11.83, $18.41, $26.30, and $37.53.
“With over 600 days below the key zone, Polkadot is gearing up for a major push.”
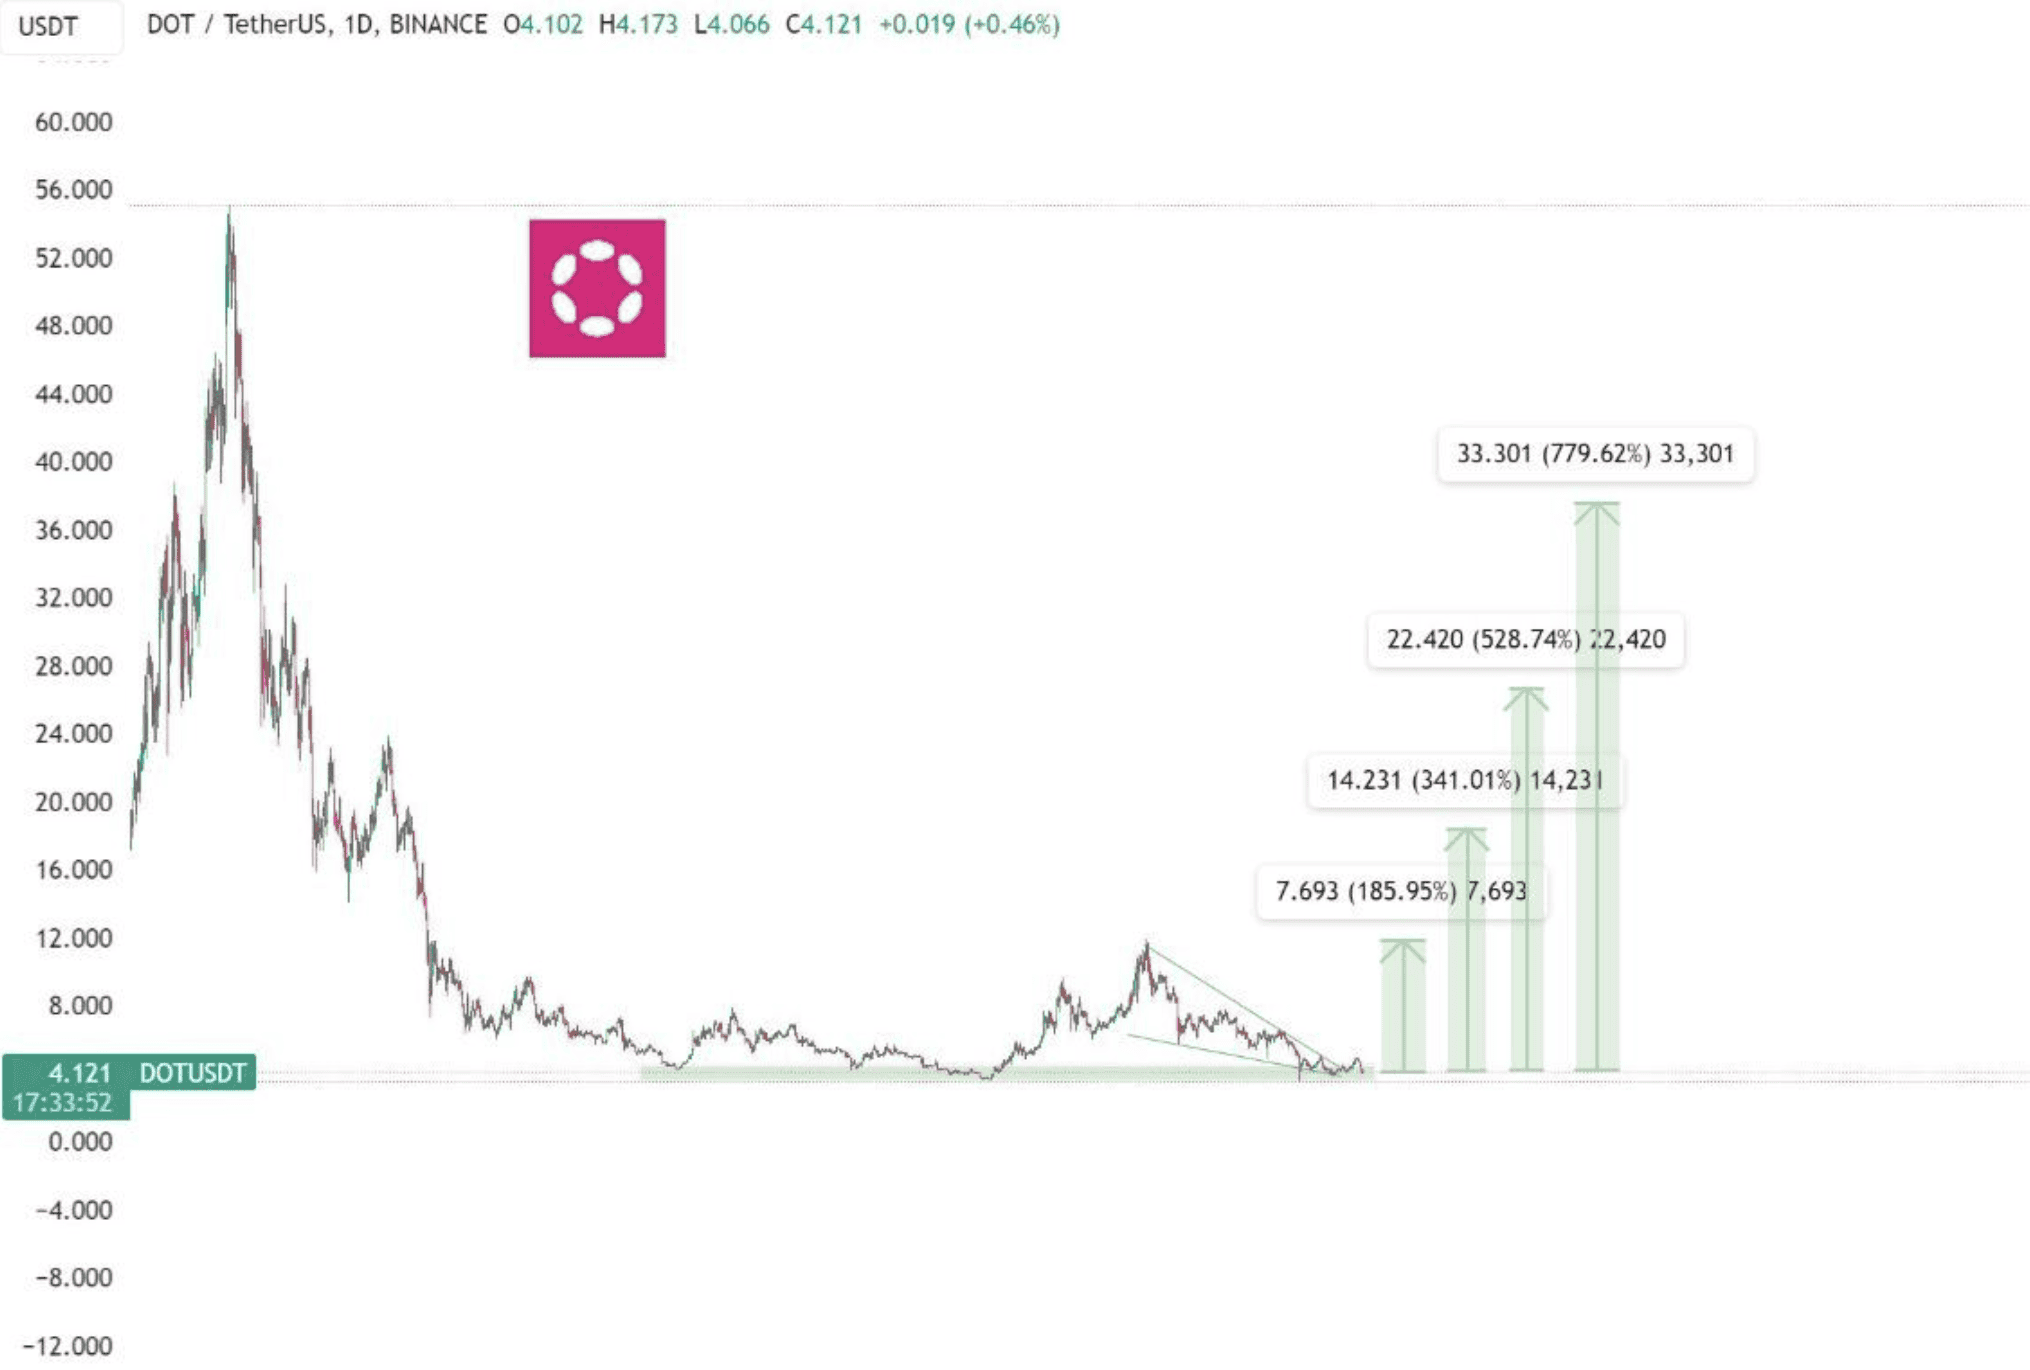
Another market observer, Lucky, also highlighted a similar promising outlook for DOT in his latest technical analysis. He said that the asset is nearing the end of its yearly accumulation phase, which could propel DOT’s price to “take off” soon.
An Outrageous Scenario Based on Historic Similarities
According to investment firm TradingShot’s latest analysis, DOT may be on track for a significant price surge, potentially reaching $200 by the end of 2025. The analysis suggests that Polkadot is following a pattern similar to Ethereum Classic’s (ETC) 2018-2021 cycle.
As shown on a one-week chart, both assets exhibit nearly identical RSI sequences. Lower highs and double tops lead into a bear market, followed by an RSI bottom that sparks a breakout above the one-week MA50 and the 0.5 Fibonacci retracement level.
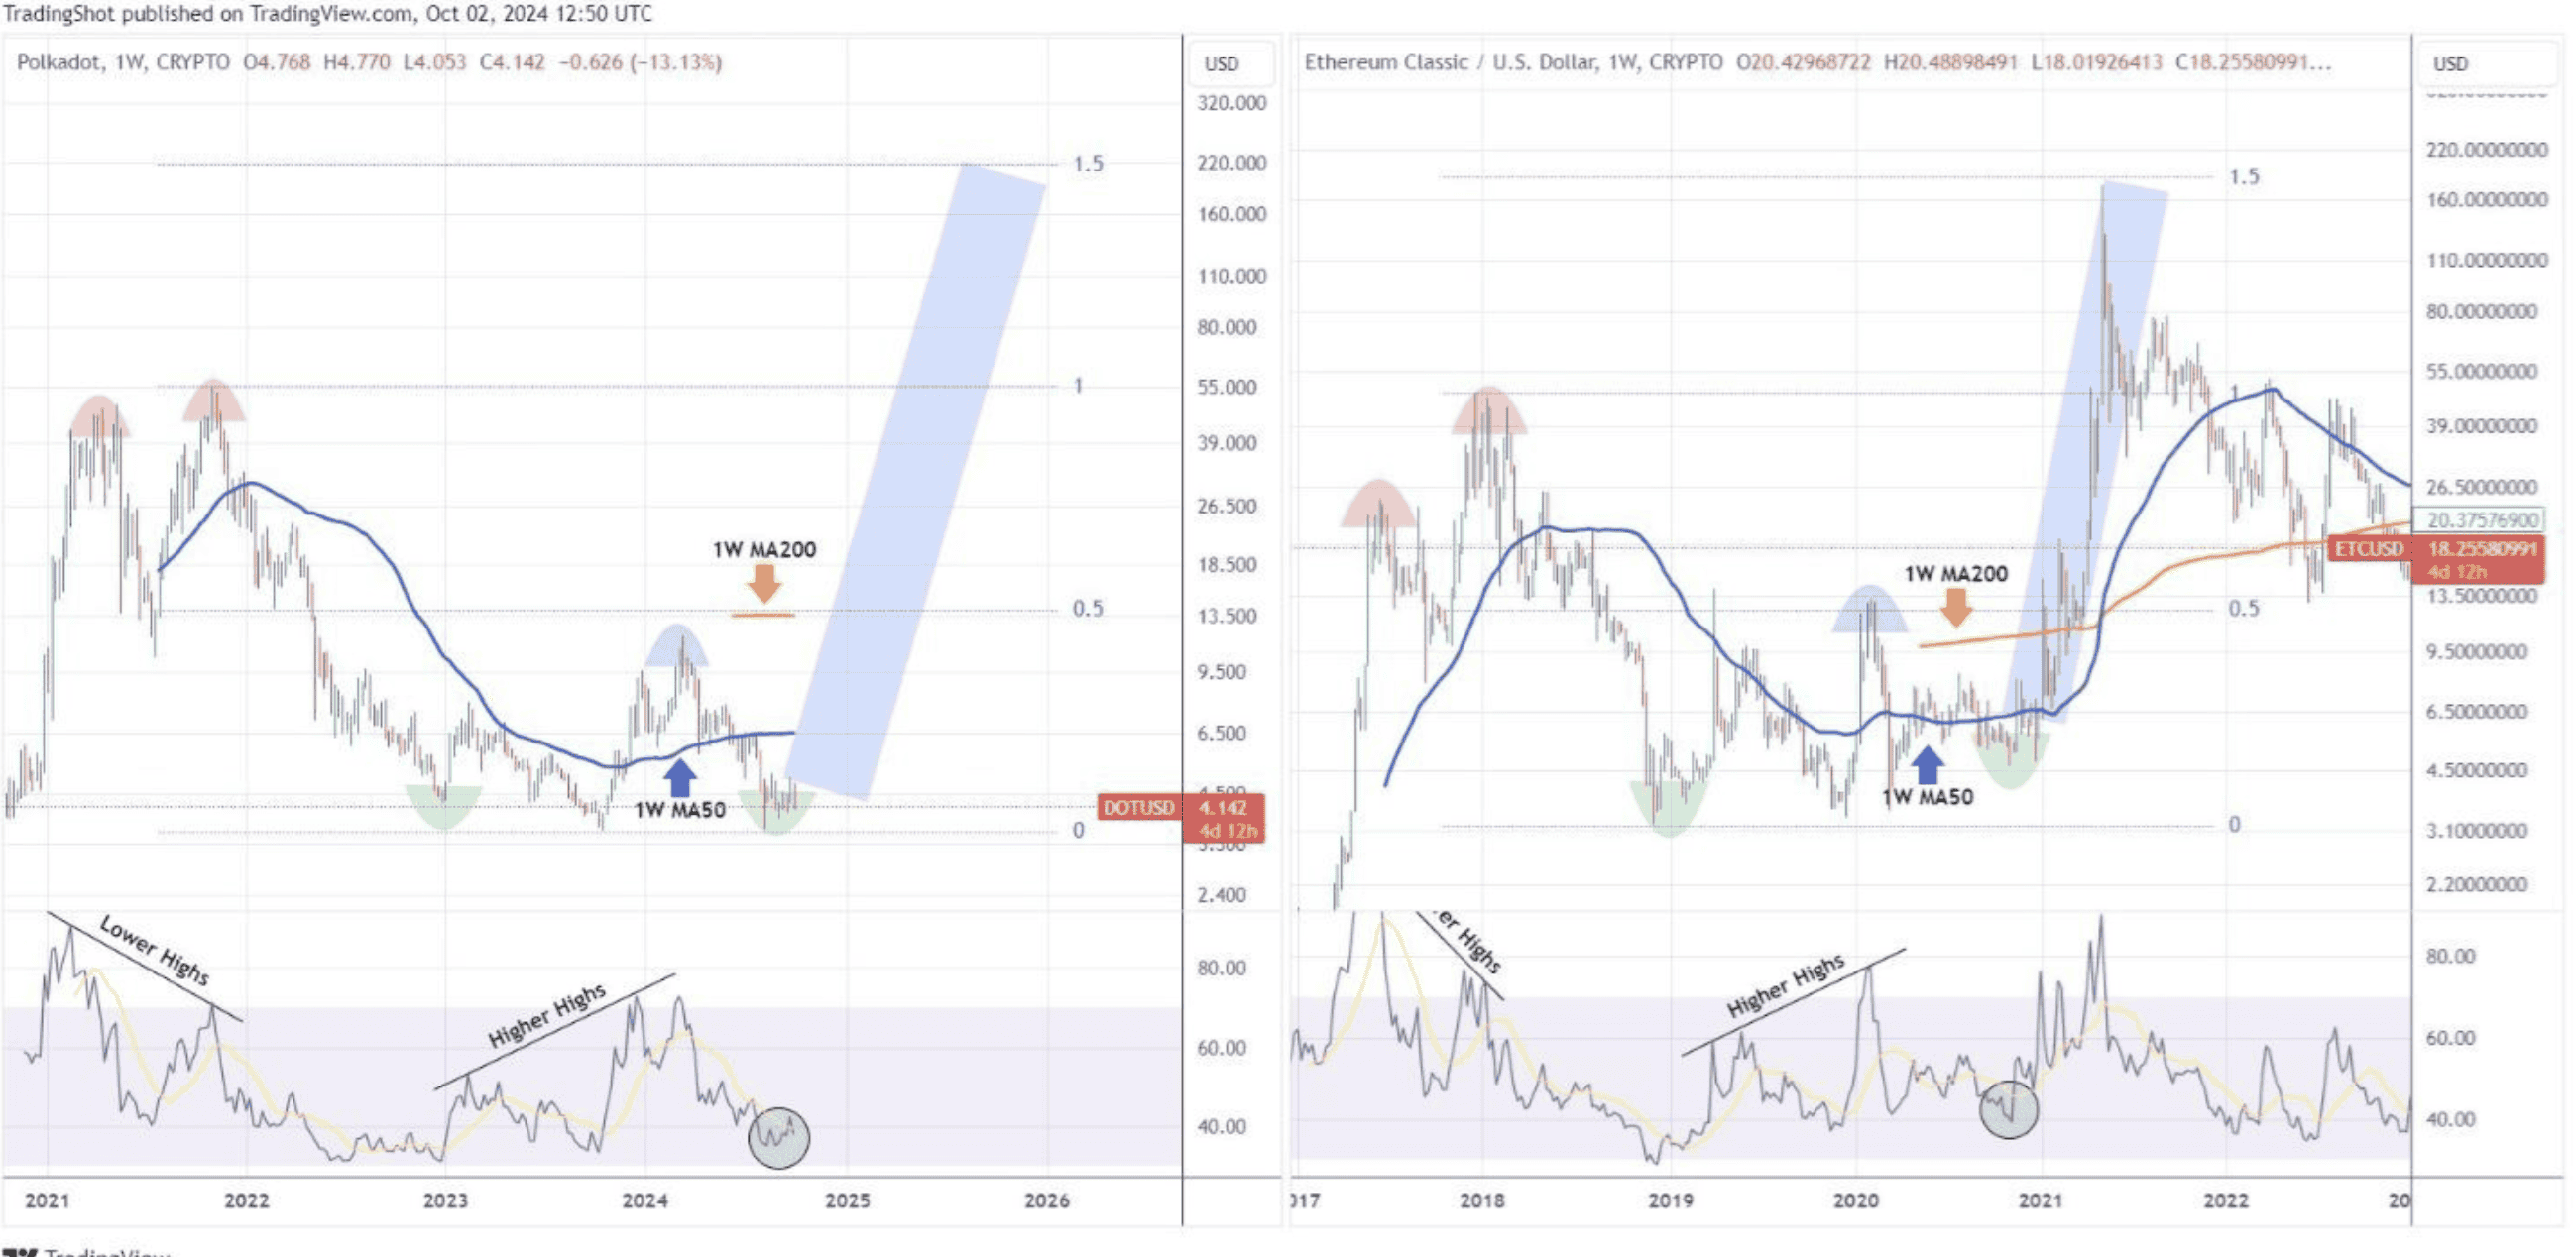
Currently, Polkadot’s RSI is hovering around 40.00, a key level that marked the start of a parabolic rally in Ethereum Classic. If Polkadot mirrors this cycle, it could aggressively rise toward the 1.5 Fibonacci extension, hitting $200 by late 2025.