


The bulls have lost grip to the bears in today’s session, as seen from the increase in the global market cap. The total cap stood at $2.22T as of press time, representing a 0.43% decrease over the last 24 hours, while the trading volume jumped by 2% over the same period to stand at $69.1B as of press time.
Bitcoin Price Review
Bitcoin, $BTC, has failed to post gains in today’s session, as seen from its price movements. Looking at an in-depth analysis, we see that Bitcoin is trading within a sideways range, showing consolidation near the middle of the Bollinger Bands. The Bitcoin price action indicates indecision, with both the upper and lower bands providing resistance and support, respectively.
On the other hand, we see that the Volume Oscillator is currently negative, indicating decreasing volume and a possible lack of momentum. Bitcoin traded at $63,389 as of press time, representing a 0.15% decrease over the last 24 hours.
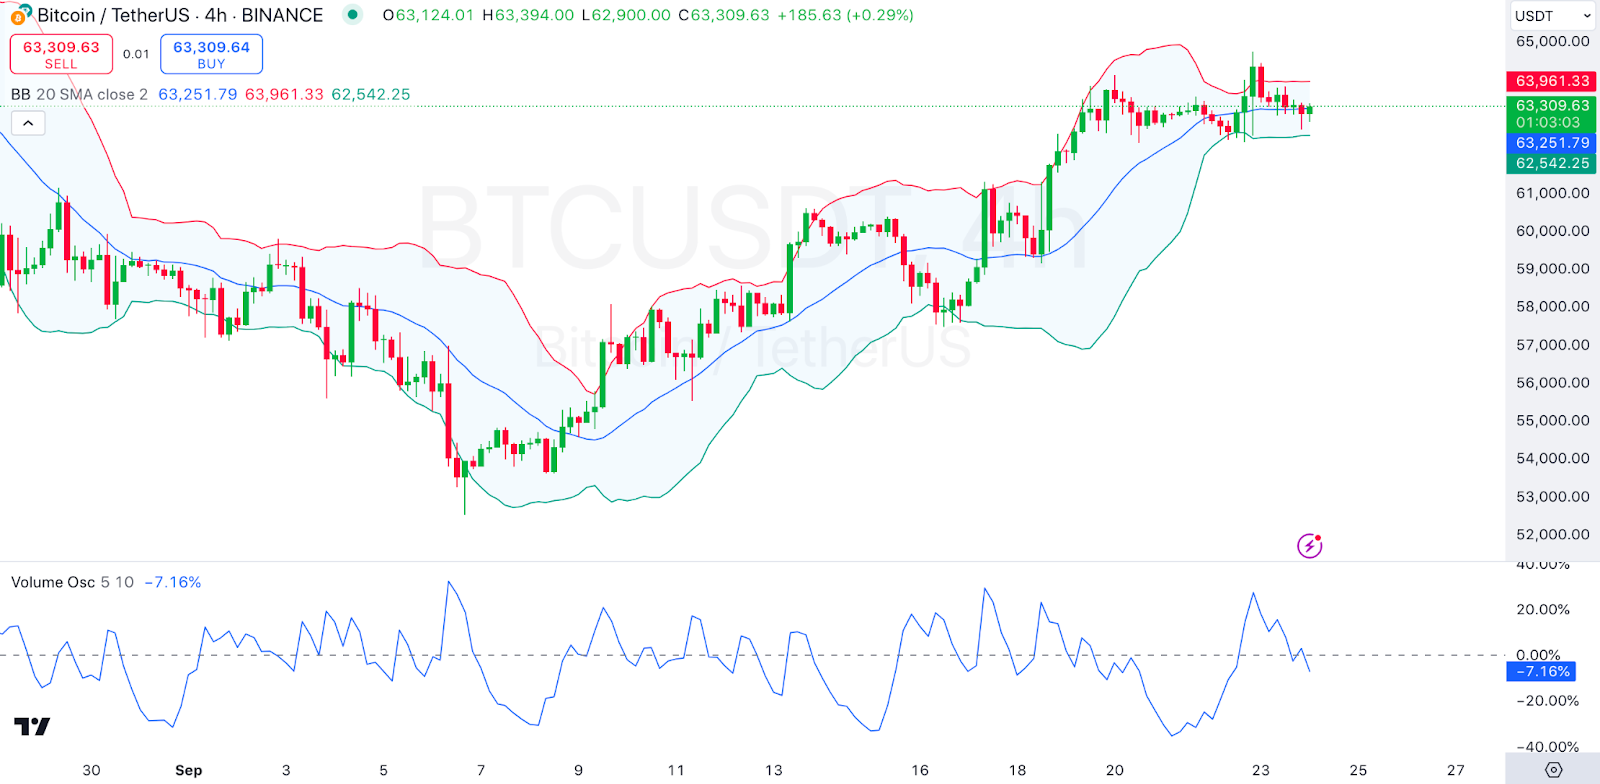 4-hour BTC/USD Chart | Source: TradingView
Ethereum Price Review
Ethereum, $ETH, is also not among the gainers in today’s session as also seen from its price movements. Looking at an in-depth analysis, we see that Ethereum shows a mild uptrend with the price trading above the Alligator lines, suggesting a bullish continuation. The Ethereum price is maintaining support above the Alligator lines, indicating continued buying strength.
On the other hand, we see that the RSI is around 67, suggesting Ethereum is approaching overbought territory but still has some room for further upside. A potential retracement could occur if the RSI moves further into overbought levels, leading to profit-taking. Ethereum traded at $2,644 as of press time, representing a 0.1% decrease over the last 24 hours.
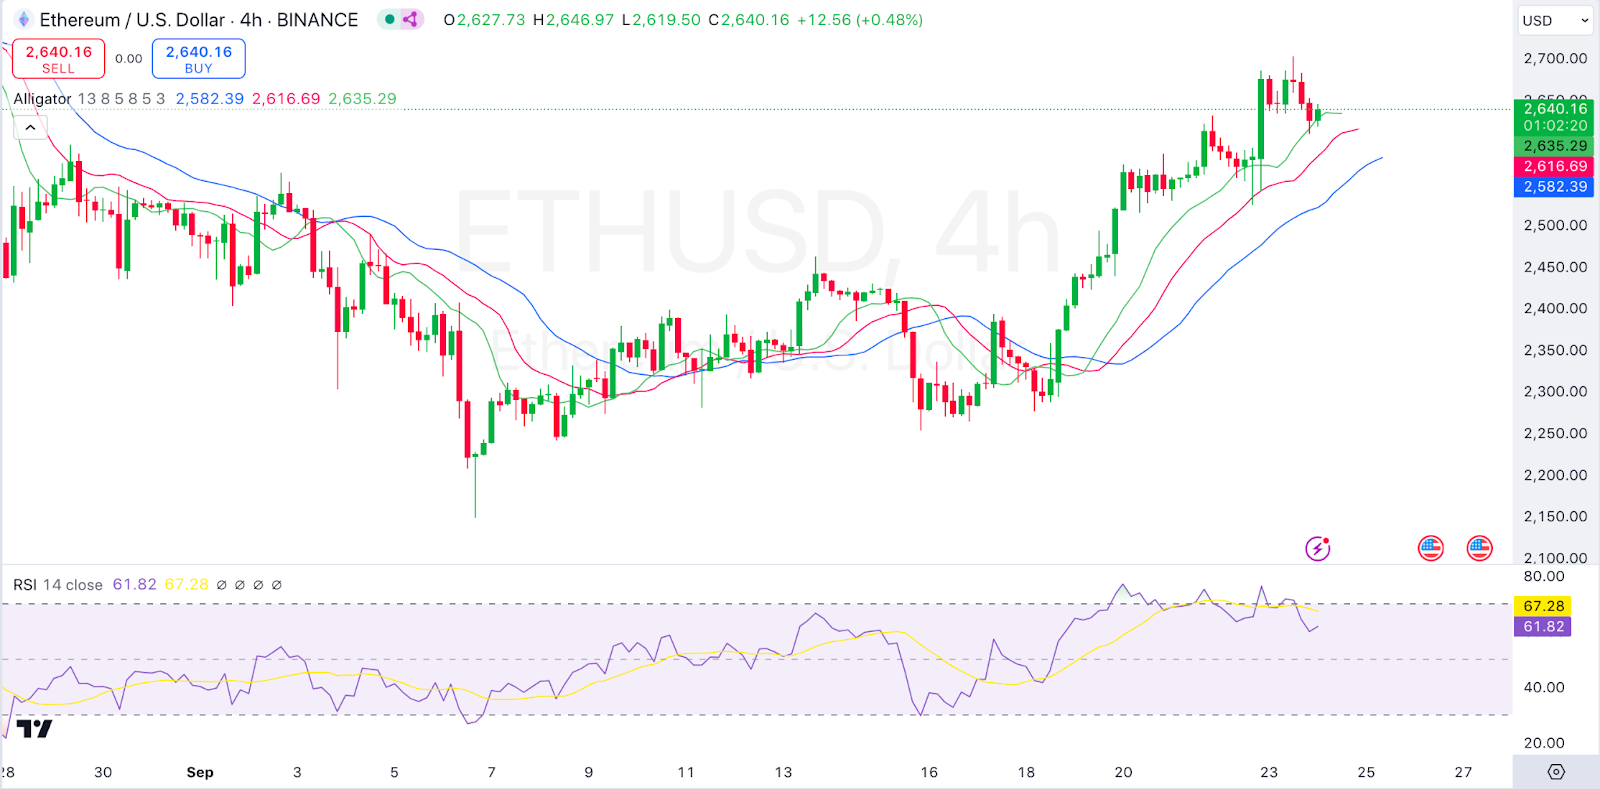 4-hour ETH/USD Chart | Source: TradingView
Celestia Price Review
Celestia, $TIA, is among the top gainers in today’s session as also seen from its price movements. Looking at an in-depth analysis, we see that Celestia shows a strong uptrend, marked by a breakout above a descending channel pattern. However, it is now retracing as evidenced by the latest series of red candle stick patterns.
On the other hand, we see that the MACD is showing bullish momentum, with a positive cross above the signal line, indicating further upward movement. The breakout above the resistance zone suggests potential for continuation, but the recent pullback could lead to a test of the breakout level as support. Celestia traded at $6.25 as of press time, representing a 14.7% increase over the last 24 hours.
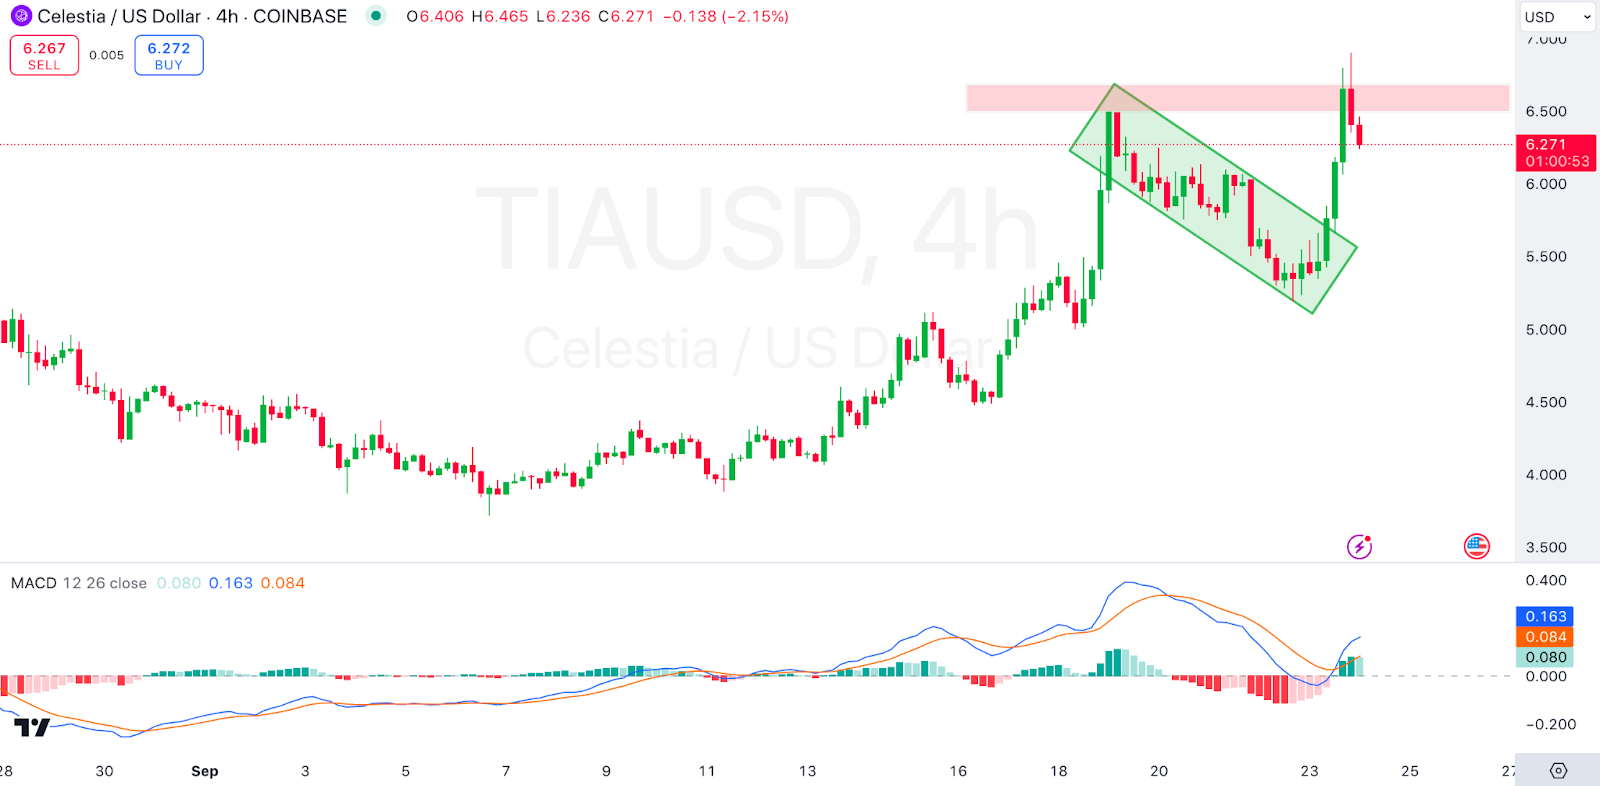 4-hour TIA/USD Chart | Source: TradingView
Ronin Price Review
Ronin, $RON, is also among the gainers in today’s session as seen from its price movements. Looking at an in-depth analysis, we see that Ronin is in a bullish phase, with the price trading above the Ichimoku Cloud and strong upward momentum. The bullish breakout above the Ichimoku Cloud suggests continued strength, but watch for potential resistance near recent highs.
On the other hand, we see that the ADX reading is 35.91, indicating a strong trend, suggesting that the recent price surge has significant momentum behind it. Ronin traded at $1.80 as of press time, representing a 9.12% increase over the last 24 hours.
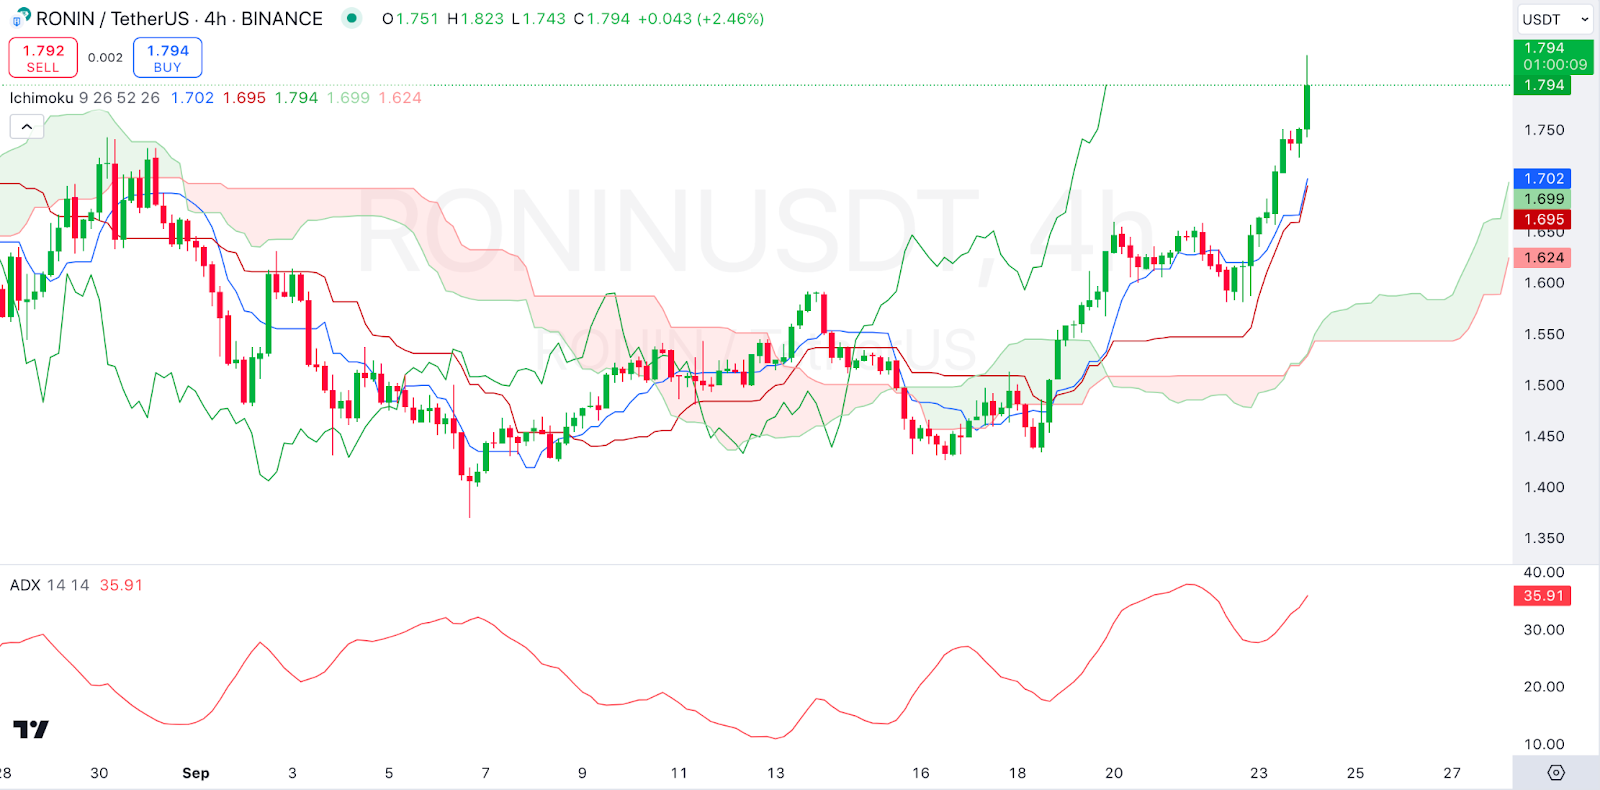 4-hour RON/USDT Chart | Source: TradingView
Arweave Price Review
Arweave, $AR, is also among the gainers in today’s session as also seen from its price movements. Looking at an in-depth analysis, we see that Arweave has reversed from a downtrend, as indicated by the Supertrend turning green, suggesting a buy signal.
The Awesome Oscillator is positive and rising, reflecting strong bullish momentum. Price action shows a breakout above prior resistance, suggesting that buyers are in control. Arweave traded at $23.35 as of press time, representing a 12.83% increase over the last 24 hours.
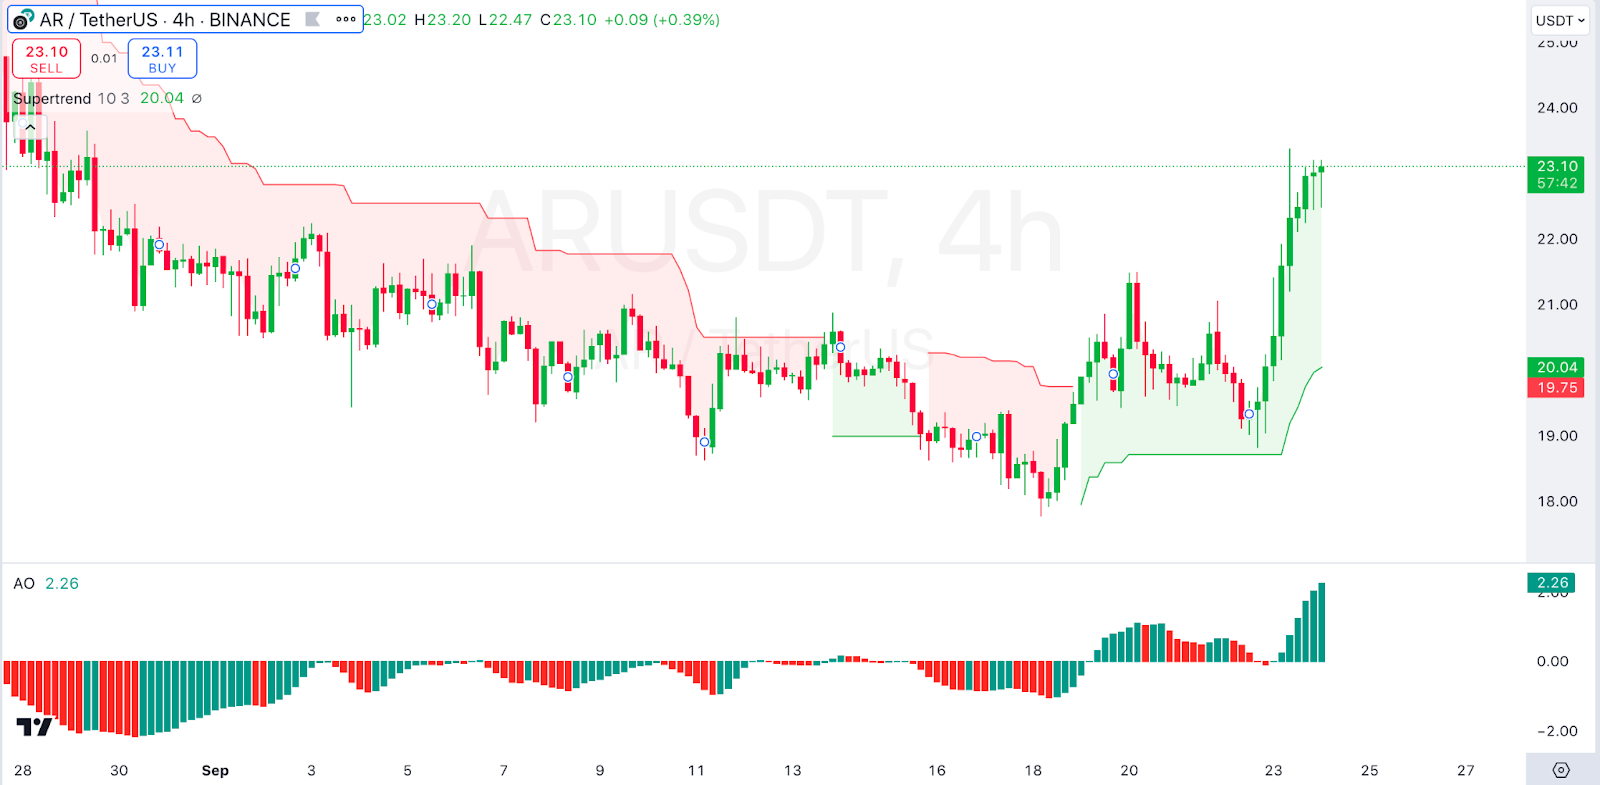 4-hour AR/USD Chart | Source: TradingView